Published June 26, 2024 06:00AM
The Triathlete's Guide to Race Fueling for Every Distance
Don't let your race be derailed by poor fueling! This step-by-step guide will help you calculate an individualized triathlon fueling plan based on your specific nutritional needs for sprint-, Olympic-, half iron-, and iron-distance racing.
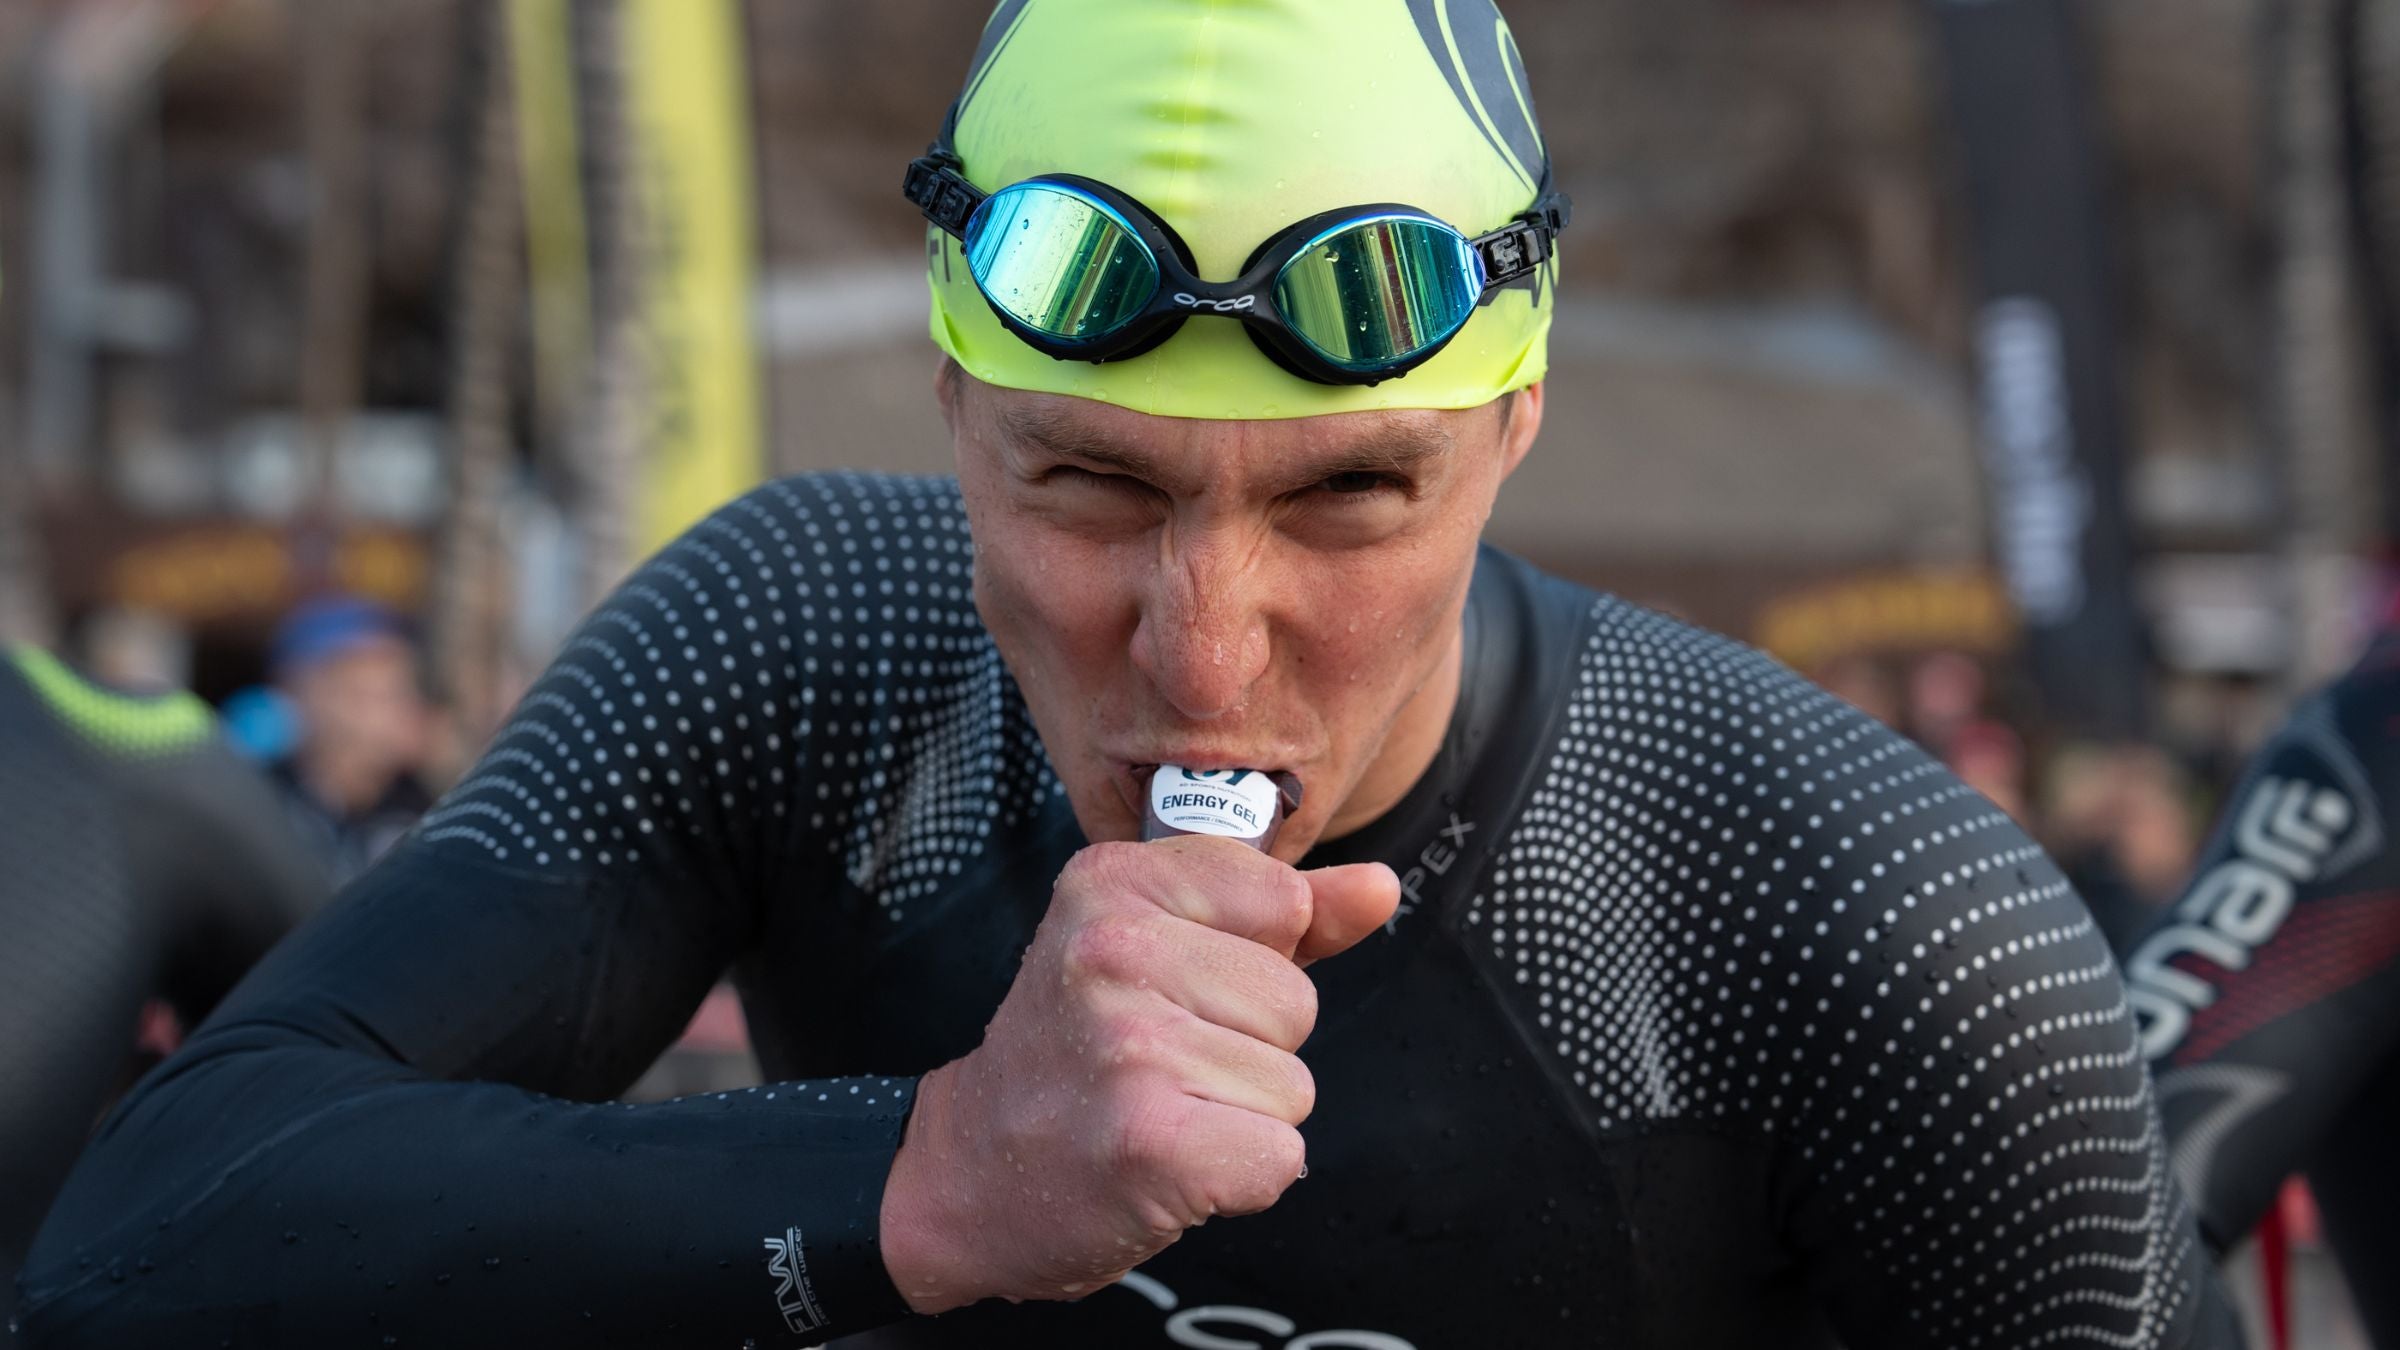
Take the guesswork out of triathlon fueling with our step-by-step guide to calculating electrolyte, carbohydrate, and fueling needs. We show you how to put together a custom triathlon nutrition plan. (Photo: Challenge Family)
How To Fuel for Triathlon
Race fueling plays such a critical role on race day that it’s often referred to as the fourth discipline of triathlon. But it’s also complicated, because race fueling varies by race duration and exercise intensity, is both universal and individualized, and can’t be distilled down to a single metric or rule. That’s why we’ve laid out a guide to help you develop your personal triathlon race fueling plan.
We’ll walk you through the steps to determine your ideal fueling “recipe” for a race of any duration, plus how to translate that recipe into an actionable plan for race day. It’s going to be a process, but if you can see it through, you’ll walk away with a reliable, individualized race-day fueling plan.
How to Determine Your Triathlon Fueling Needs
Your fueling plan recipe will include carbohydrates, fluid, and electrolytes, as all three “ingredients” are necessary for your body to function at its best while exercising. Each ingredient depends on the others for your triathlon fueling plan to work: carbs and electrolytes require fluids, and fluids require electrolytes.
Carbohydrates
Carbohydrates (a.k.a., carbs) are the fuel in your fueling plan. Like gasoline in a car, they’re necessary for your engine to run. But not all carbs are created equal, and no matter how much you take in, the body’s ability to break down and use carbs for fuel is limited by intestinal absorption.
The best carbohydrate for exercise is glucose, because glucose is our primary cellular fuel source. We process glucose using our glucose transporter 1 (SGLT1), which can absorb a maximum of 60 grams per hour (g/hr) of glucose. For shorter exercise durations (under 2.5 hours) 30-60 g/hr of glucose will sufficiently fuel our bodies. For exercise lasting 2.5 hours or longer, our bodies need more fuel than SGLT1 can provide.
ADVERTISEMENT
By tapping into our fructose transporter (GLUT5), we can absorb an additional 30 g/hr of fructose, bringing our total absorption up to 90 grams of carbs per hour. Over all durations, our bodies have a harder time digesting carbs on the run because of the jostling of the gut while running, the higher exercise intensity, and the inevitable dehydration. So while we look to maximize carb intake on the bike, we are more conservative with carb targets on the run.
By putting all of this together, we arrive at the following carbohydrate guidelines:
| Races up to 2.5 Hours | Races lasting 2.5+ Hours | |
| Bike Guidelines | 30-60 g/hr of glucose | 60-90 g/hr of glucose and fructose |
| Run Guidelines | 30-50 g/hr of glucose | 50-70 g/hr of glucose (and fructose if over 60 g/hr) |
A little fine print on carbs and carb requirements in triathlon:
- Maltodextrin is chemically produced glucose, and sucrose (table sugar) is a combination of glucose and fructose. Therefore, ideal carb combinations for exercise lasting 2.5 hours or longer include: glucose + fructose, maltodextrin + fructose, and glucose + sucrose + fructose.
- There is no relationship between body mass and carbohydrate utilization; guidelines for intake during exercise are universally expressed in grams per hour relative to exercise duration and are not based on body mass.
Fluids
Fluids, like water in a car radiator, keep us from overheating. Specifically, thermoregulatory, cardiovascular, and performance responses are optimized by replacing sweat (fluid) loss during exercise. In contrast, dehydration (lack of fluids) increases physiological stress on the body through elevated core temperature, heart rate, perceived exertion, and gastrointestinal (GI) distress.
During your race, you need to replace fluid loss from sweat and respiration. But how do you know how much fluid that is? On one hand, it’s a tricky question because fluid loss rates (a.k.a. sweat rates) are highly individual and there is no one-size-fits-all fluid replacement plan. On the other hand, it’s a fairly easy question because your sweat rate can be determined during a routine training session if you have access to a digital scale.
ADVERTISEMENT
The table below outlines the steps to complete a sweat rate test. A sweat rate test is best done in conjunction with a 1-hour bike or run workout, since you’re measuring your hourly fluid loss, but can be scaled for different workout durations (45 minutes minimum). Since you need to net out anything consumed during the workout, plan to consume fluid only (no gels or solid food). Remember that urination or a bowel movement during the workout will affect the calculation, so hold off until after your post-workout weigh-in.
How to complete a sweat rate test
| How to complete a sweat rate test | Example |
| 1. Weigh yourself (in the nude) immediately before your workout. | 169 lbs |
| 2. Complete your workout, noting the workout duration, intensity, temperature and humidity, and amount of fluid consumed | 60 min run 12 oz consumed |
| 3. Weigh yourself (in the nude) immediately after your workout, toweling off excess sweat as best as you can | 167.8 lbs |
| 4. Calculate pounds of body weight lost during exercise | 169-167.8 = 1.2 lbs |
| 5. Convert pounds to ounces (16 oz = 1 lb) | 1.2 lb x 16 oz = 19.2 oz |
| 6. Add back in fluid consumed, in ounces, to measure total fluid loss during exercise | 12 +19.2 = 31.2 oz |
| 7. That number divided by number of hours exercised is your hourly fluid loss rate | 31.2 oz / 1 hr = 31.2 oz/hr |
Once you’ve completed your sweat rate test and have calculated your hourly sweat rate (fluid loss rate), you have also determined your fluid replacement needs. Target hourly fluid consumption equal to your hourly fluid loss rate on the bike; on the run, where a full stomach is less tolerable, aim for at least 70% of your hourly fluid loss rate.
The fine print on fluid loss and fluid consumption:
- Your sweat rate will vary based on the weather and the workout intensity, so repeating the sweat rate test under varying conditions – race-like conditions in particular – will provide a more complete picture of your projected sweat rate for race day.
- Maintaining gastric (stomach) volume promotes gastric emptying (fluid absorption) during exercise, so start your race with a comfortable amount of fluid in your stomach and consume fluids at regular 10-15-minute intervals during the race.
- Leaning on your thirst mechanism signal to guide your hydration is a poor strategy as once your thirst mechanism triggers you are already slightly dehydrated.
- Fun fact #1: One medium mouthful of fluid equals about 1 ounce.
- Fun fact #2: A standard-issue bike bottle holds 20-24 ounces of fluid.
Electrolytes
Electrolytes, namely sodium, are the final ingredient in our fueling plan recipe. Consuming sodium stimulates the drive to drink, helps maintain blood volume, reduces urine production, and assists in the absorption and retention of fluids. In contrast, a lack of sodium increases cardiovascular and thermal strain, degrades athletic performance, and in some severe cases can lead to hyponatremia, a dangerous and possibly life-threatening condition.
Much like fluids, sodium requirements are highly individual and there is no one-size-fits-all formula for electrolyte replacement. And while there’s nothing quite like the at-home sweat rate test to determine your sweat sodium concentration – the ratio of sodium to fluid in your sweat – there are some ways to ballpark your sodium requirements. Crusty, white salt marks on your face, hat, or clothing after exercise are a strong indication that you have a high sweat sodium concentration. Your taste buds can also provide an indication of your sweat sodium concentration – high sweat sodium concentration athletes will routinely reach for salt with their meals.
ADVERTISEMENT
To maintain your body’s natural sodium concentration, aim to consume sodium in accordance with your natural sodium-to-fluid ratio:
| Low Sweat Sodium Concentration | Moderate Sweat Sodium Concentration | High Sweat Sodium Concentration |
| 300-450 mg / 24 oz fluid | 600-800 mg / 24 oz fluid | 1000-1500 mg / 24 oz fluid |
While these ballpark estimates will work for most athletes, if you’ve struggled with hydration and electrolyte balance in the past you might benefit from having a more precise understanding of your sweat sodium concentration. Products like the Gx Patch from Gatorade (which requires their iPhone app, no Android option), the hDrop and Nix Biosensor wearables, and the Levelen mail-in sweat testing kit can provide a more accurate measurement of your sodium needs.
The fine print on electrolytes for triathlon:
- Unlike carbs and fluids, which we plan to consume at an hourly rate, we consume sodium in proportion to our fluid intake.
- When interpreting results from a sodium concentration test, keep in mind that there are a wide range of factors that influence the measurement, so take those results with a grain of salt (pun intended).
- If you receive your sweat sodium concentration test results in mg/liter, multiply the result by 2/3 to approximate your sodium requirements per 24 oz of fluid.
Translating “raw” ingredients to specific fueling sources
OK – you still with us? You’re doing great. We’ve done the big job of determining your carbohydrate requirements and your individual fluid and sodium needs. But since you’re not likely to fuel your race with water bottles containing straight glucose, fructose, and sodium, let’s talk about how you can translate your ingredient list to sources like sports drinks, gels, chews, and bars.
Sports Drinks
Properly formulated sports drinks offer a practical and easy way to consume fluids, electrolytes, and carbohydrates while optimizing digestion and absorption. Because consuming fluids is non-negotiable in endurance exercise, a sports drink provides a convenient and easy-to-replicate strategy for meeting fluid, sodium, and carbohydrate needs. Read this primer on how to choose the best sports drink for you, or if you’d like to go the DIY route, here’s how to make your own.
ADVERTISEMENT
Gels & Chews
Energy gels and chews offer a high concentration of carbs in a small serving size, but also require approximately 8-12 ounces of water consumption per serving to optimize absorption.
Sport Bars
Sport bars – and specifically chewing them – can offset hunger and are often used during the bike portion of the race. However, the nutritional makeup of sports bars varies widely so be sure to check the nutrition label and look for low protein, low fat, and low fiber options. Limit bar intake to the bike portion of long-course events and stop consumption 90-120 minutes out from T2 to help mitigate GI distress on the run.
ADVERTISEMENT
The fine print on fueling sources:
- Look for products with short and simple ingredient lists: carbohydrates, sodium, natural flavors, and preservatives (such as citric acid).
- During the run, avoid or strictly limit protein, fat, and fiber as they can lead to GI distress.
- If you use caffeine in racing, include it in a supplemental carb source(s) such as chews or gels to better control the dosage. Too much caffeine can lead to GI distress and a host of other issues.
Once you’ve determined your preferred fueling sources, look on the nutrition label to find the serving size of each as well as the grams of carbs, ounces of fluid, and milligrams of sodium delivered per serving. You’ll need this for the next step.
A Step-by-Step Guide to Developing Your Triathlon Race Fueling Plan
We’re here! You’ve done all the work to understand your race fueling needs and to identify the specific fueling sources that you’ll use on race day. Pat yourself on the back, that was definitely a process.
Now we’re going to dive one final level deeper and figure out exactly how much of each fueling source you’ll consume per hour during both the bike and run legs on race day. This is where the complexity kicks up yet another notch, so we’ll follow along with “Athlete Andy” as he walks through our step-by-step guide to developing your triathlon fueling plan.
Once you are comfortable with the process, you can download a PDF of the Step-by-Step Guide here and complete the steps for your race duration, fueling requirements, and fueling sources.
ADVERTISEMENT
Step 1: Define your carb, fluid, and sodium targets
Use what you learned in Part I to define your carbohydrate, fluid, and sodium targets.
ADVERTISEMENT
Athlete Andy is preparing for a half-distance triathlon and is targeting the middle range of the carbohydrate guidelines for 2.5+ hour races. His sweat rate is 30-32 oz/hr per his at-home sweat rate testing and he estimates that he has a moderate sweat sodium concentration, requiring approximately 600-800 mg of sodium per 24 oz of fluid.
| Carbs | Fluids | Sodium | |
| Bike Targets | 70-80 g per hour | 30-32 oz per hour | 600-800 mg per 24 oz of fluid |
| Run Targets | 50-60 g per hour | 24-27 oz per hour | 600-800 mg per 24 oz of fluid |
Step 2: Identify your carb, fluid, and sodium sources
Next, identify your primary fueling, hydration, and electrolyte sources for the bike and the run. Using nutritional labels for each product, note the carbs, fluids, and sodium provided per serving for each source.
Athlete Andy plans to use a sports drink as his primary fuel source on the bike. He’ll bring gels for the run and rely on water from the aid stations throughout the race course for additional fluids.
| BIKE | ||||
| Serving Size | Carbs/Svg | Fluids/Svg | Sodium/Svg | |
| Sports Drink | 2 scoops/24 oz bottle | 60 g | 24 oz | 600 mg |
| Water at aid station | 24 oz bottle |
| RUN | ||||
| Serving Size | Carbs/Svg | Fluids/Svg | Sodium/Svg | |
| Gels | 1 gel | 30 g | 200 mg | |
| Water at aid station | 4 oz* |
*An 8 oz aid station cup, approximately half-full
Step 3: Quantify your carb, fluid and sodium intake
Determine how many servings of each source you’ll consume per hour and calculate totals for carbs, fluid, and sodium intake from each source. Compare your calculated totals to your targets for carbs, fluids, and electrolytes.
Athlete Andy plans to consume 1 bottle of sports drink and 1/3 bottle of water each hour from each aid station on the bike. On the run, Athlete Andy plans to consume a gel every 30 minutes and 1 cup of water at every aid station, or approximately every 10 minutes.
Because we look at sodium intake per 24 oz of fluid (per standard-issue bike bottle) and not per hour, Athlete Andy needs to do a little math: Planned hourly sodium intake / Planned hourly fluid intake = Planned sodium concentration. If planned sodium concentration is per something other than 24 oz, multiply planned hourly sodium intake by 24 and divide by planned hourly fluid intake to adjust the ratio.
| BIKE | ||||
| Servings/Hr | Carbs/Hr | Fluids/Hr | Sodium | |
| Sports Drink | 1 bottle | 60 g | 24 oz | 600 mg |
| Water | 1/3 bottle per aid station | 8 oz | ||
| TOTAL | 60 g | 32 oz | 600 mg/32 oz 600 * 24/32 450 mg/24 oz | |
| Target | 70-80 g | 30-32 oz | 600-800 mg/24 oz |
| RUN | ||||
| Servings/Hr | Carbs/Hr | Fluids/Hr | Sodium | |
| Gels | 2 gels (1 per 30 min) | 2 * 30 g = 60 g | 2 * 200 mg = 400 mg | |
| Water | 6 (one cup per aid station) | 6 * 4 oz = 24 oz | ||
| TOTAL | 60 g | 24 oz | 400 mg / 24 oz | |
| Target | 50-60 g | 24-27 oz | 600-800 mg / 24 oz |
Step 4: Adjust sources and/or servings, re-calculate, and compare again
If your calculated totals do not align with your targets for carbs, fluids, and electrolytes, it’s time to make some adjustments. Add sources to fill gaps, adjust servings if needed, and compare again. Repeat until your totals align with your targets.
Athlete Andy is short on carbs on the bike and electrolytes on both the bike and the run. He decides to add chews and electrolyte tablets to address these deficits.
| BIKE | ||||
| Servings/Hr | Carbs/Hr | Fluids/Hr | Sodium | |
| Sports Drink | 1 bottle | 60 g | 24 oz | 600 mg |
| Water | 1/3 bottle per aid station | 8 oz | ||
| Chews | 2 chews (1 per 30 min) | 2 * 8 g = 16 g | 2 * 16 mg = 32 mg | |
| Electrolyte Tablets | 2 servings (4 tablets) | 2 * 100 mg = 200 mg | ||
| TOTAL | 76 g | 32 oz | 832 mg/32 oz 832 * 24/32 624 mg/24 oz | |
| Target | 70-80 g | 30-32 oz | 600-800 mg/24 oz |
| RUN | ||||
| Servings/Hr | Carbs/Hr | Fluids/Hr | Sodium | |
| Gels | 2 gels (1 per 30 min) | 2 * 30 g = 60 g | 2 * 200 mg = 400 mg | |
| Water | 6 (one cup per aid station) | 6 * 4 oz = 24 oz | ||
| Electrolyte Tablets | 2 servings (4 tablets) | 2 * 100 mg = 200 mg | ||
| TOTAL | 60 g | 24 oz | 600 mg / 24 oz | |
| Target | 50-60 g | 24-27 oz | 600-800 mg / 24 oz |
How to Take Your Triathlon Fueling Plan on the Road
You’ve now written your official Race Fueling Plan and you’re ready to put it into action. Be sure to test out your Race Fueling Plan in training well before race day. Training sessions and practice races provide opportunities to sort through the logistics of your fueling strategy, get accustomed to the cadence of your fueling plan, and sort through any complications you may not have foreseen. Once you’ve fine-tuned the plan, use it in training regularly to ensure that your gut is well-prepared and that you can reliably execute your plan as you’ve written it.
The final bits of fine print:
- If you’re not used to fueling at these levels, you’ll need to work up to your carbohydrate and fluid targets and teach your GI system to absorb carbs and fluids at higher rates.
- Adapt your plan to race conditions – warmer races require more fluids, colder races require more carbs, and races at altitude require both more fluids and more carbs.
- Always have a backup plan in case of a dropped bottle, etc. Know what’s offered on the course and how those products can be used in substitution for your original fueling sources.
And with that, you are ready! Go forth and fuel!