Published September 25, 2022 08:19AM
Data Dive: 9 Takeaways on Qualifying for Kona
We mined Ironman finisher data to find out what it takes to qualify for Kona — and what it means for athletes going forward.
(Photo: Tom Pennington/Getty Images)
In just a few weeks, the Ironman World Championship will return to Kona for the first time in over three years, where we will once again be able to see a display of the best of the best in Ironman racing. But what does it take to get a Kona spot? Let’s do a quick data dive to better understand who the athletes from the last Ironman World Championship in Kona (2019) were, and explore how they’ve changed over the years. Here are nine insights about 2019’s Kona athletes.
RELATED: Ironman World Championship Kona 2022 Coverage
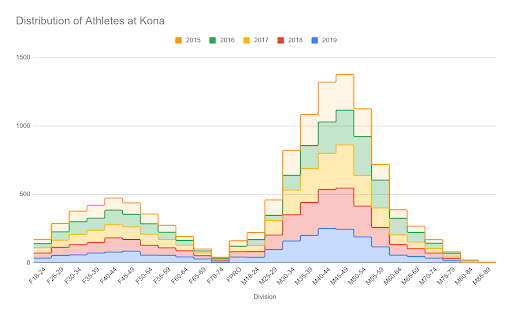
1. Distribution of athletes at Kona is shifting older
It will not come as a surprise that the majority of athletes at Kona 2019 were men between 30 and 59—clearly a reflection of the distribution of athletes who attend the qualifying races. The chart below shows the spread of age groups throughout time. It is beginning to skew younger for the males—the leading age group shifted from the 45-49 group to 40-44. For female racers it’s the reverse: the largest group is moving from 40-44 to 45-49.
2. One does not simply walk into Kona
- Out of the 2000+ athletes in Kona 2019, 337 of them had only completed one full Ironman when they qualified.
- Since 2015, the average number of full Ironman races completed by Kona age-groupers was 3.8. For men that was 3.9, and for women it was 3.7.
- Getting to Kona requires plenty of experience with full distance triathlons.
RELATED: Triathlete’s Complete Guide on How to Train for an Ironman
ADVERTISEMENT
3. Men have more opportunity for Kona qualifying spots
On average, athletes who qualified for Kona placed 4th at their qualifying event. For women, that average ranking was 1.77, and for men, the average was 4.86. In fact, 25% of the men ranked 5th or lower in their fastest race leading up to Kona. Because Kona slots are currently distributed proportionally, and because women make up a smaller proportion of the age-group field at Ironman events (an average of 21% of the field, globally), it’s not uncommon for there to be only one or two Kona spots for a women’s age group at an Ironman event, but six or seven for men in the same age group. Roll-downs may also come into play here; when there are more spots available in an age group, there’s a greater chance at least one of those spots (if not more) will be declined and roll down to the next-place finisher.
RELATED: How A Mom of Four and Full-Time Math Teacher Qualified For Kona
4. The older and younger athletes rank higher to qualify for Kona
Though there is less competition in the younger and older age groups, it’s also harder to punch a ticket to Kona. Again, this is due to the way Ironman distributes Kona slots proportionally; older and younger age groups tend to have the smallest number of participants, so most races will only have one spot available for those age groups.
ADVERTISEMENT
The average qualifying rank for men above 65 was 1.4, and for athletes in their 20s it was 2.5. For the 30-54 group, it was 6.5. For women, the distribution is similar, but it’s a much tighter competition. The 30-54 average qualifying rank is only 2.1, while at the tail ends (the young and old) it’s smaller (1.4 and 1.2 respectively).
5. Athletes who made it to the start line at Kona were more likely to make it to the finish line
It’s to be expected that not all racers will be able to finish a demanding event like a full-distance Ironman. Some don’t even make it to the start line. In the qualifying races, an average of 19.8% of athletes were either DNS (did not start) or DNF (did not finish). At Kona, that only applied to 155 out of the 2,129 registered athletes in 2019, or 7.2%. It makes sense: If you qualify for Kona, you’ve likely got a certain degree of fitness and injury resilience (and non-refundable hotel reservations). Athletes also probably have the determination to make it to the famous Ali’i Drive, grueling though the course and conditions may be.
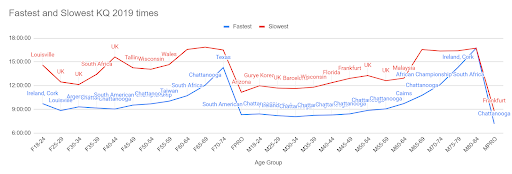
6. Chattanooga had the fastest KQ times, UK had the slowest
Of the full Ironman races (Ironman France was shortened significantly in 2019), the majority of the fastest qualifying times came from Ironman Chattanooga. On the other hand, Ironman UK’s difficult conditions and course led to most of the slowest KQ times. The difference between the fastest and slowest qualifying times was as big as 6 hours in the same age group!
RELATED: The Fastest Ironman and 70.3 Courses
ADVERTISEMENT
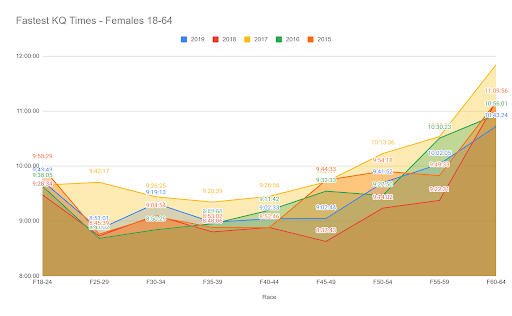
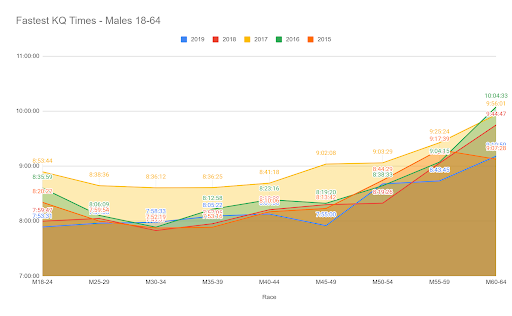
7. Qualifying times are getting faster over time
Since 2015, overall KQ times are getting faster, as the chart below shows. The red and blue lines (fastest times for 2018 and 2019, respectively) are generally below the other year’s line trends.
RELATED: How Many Training Hours Does It (Really) Take to Conquer Ironman?
8. If you are at Kona, chances are you’ve been there before
Making it to Kona is more than just a bucket list item. Of the 2,100 athletes at Kona 2019, 871 of them had been there before. That’s 40% of all the racers! Of those, 806 were age-groupers (39.6%). Sixty-five pros repeated, which is 72% of all the pros. Once you make it to Kona, you’ll likely be coming back. If you think this is just a fluke, think again: 220 athletes had been in Kona the last four years…in a row! For 813 AG athletes in 2019, this was at least their third time in Hawaii.
ADVERTISEMENT
9. Winning begets winning
Though everyone loves a surprise winner, most age-groupers don’t reach the Kona podium on a fluke. In fact, all but five of the top three finishers in every age-group category at Kona had already finished first in a prior Ironman race that year. Of those five who weren’t, only one of them had never made it to an Ironman podium before.
Making it to Kona is the ultimate dream for many triathletes. The data show how hard you’ll have to work for it, especially women, who are fighting for fewer spots. And with qualifying times getting faster over time, reaching Kona is getting harder and harder. The good news is that once you’ve made it to Kona, you’ll likely be coming back year after year.
ADVERTISEMENT
It’s been three years since we had our last Ironman World Championship in Kona. How will the makeup of athletes, qualifying times, and results compare to what we have been seeing in the last few editions of the Ironman World Championship? Watch this space for an updated analysis.
RELATED: How to Watch the 2022 Ironman World Championship Races