Published February 14, 2023 09:32AM
New 2023 PTO Rankings Revealed & Dissected
The Professional Triathletes Organization has released an update to their much-maligned pro ranking system. The result is...complicated.

(Photo: Professional Triathletes Organization)
Ever since the Professional Triathletes Organization got some big-money backers and really put down its marker on the sport, one of the key ways to distribute that wealth has been through its rankings system.
Being ranked number one in the PTO system is more than just about ego; it’s worth its weight in gold. Last year, Kristian Blummenfelt and Anne Haug scooped $100,000 each as part of the $2 million payout, and the rankings are also used to provide the first four spots for each region in the lucrative Collins Cup, where another $1.5M is forked out in appearance fees. Bear in mind, this is all on top of prize money and sponsorship dollars.
With some hard greenbacks to be fought over, it’s little wonder that long course professionals care that the system is fair, and why – after receiving much criticism in its first three years – it’s having an overhaul for 2023.
But before we dive into the nitty-gritty of the new rankings, it’s worth a quick recap of the old system and why there was a movement for change.
ADVERTISEMENT
What were the original PTO Rankings?
Introduced in 2020, the original rankings took the average points score from a triathlete’s best three races over the course of 12 months.
So far, so easy, but all of those super-important points came from a triathlete’s finish time [not position] that was held up against something the PTO called an Adjusted Ideal Time (AIT) for each race.
The AIT was based on an algorithm that took in factors such as previous times on the course and how fast the course was on that specific day. Then, a few days after the race, the points would be issued. The AIT target time was worth 100 points. Go faster, you get more. Slower, you score less.
ADVERTISEMENT
There were a couple of minor tweaks over the system’s three-year run, including upweighting certain races, but chiefly it remained the same time-based format.
So, what was the problem?
The problems were multiple, but an overriding issue was one of transparency. Triathletes and fans just didn’t know – and it wasn’t or couldn’t be properly explained – how the algorithm worked. Understandably, this led to conspiracies about how the numbers were actually crunched and to much ire if you scored less than you thought you deserved.
Additionally, a triathlete would only find out how many points they’d scored several days after the race finished and given the system was 100% time-based, it put the onus on triathletes to thrash themselves to reach the finish line in every race – even if they were winning by minutes.
ADVERTISEMENT
In its defense, the PTO has always said that the system was a solution for a pandemic where its members might not have the opportunity to travel freely and, in theory at least, have equal chance to score points in more local races.
What’s the solution?
The PTO acknowledged there was an issue, listened to feedback, and decreed to make ”improvements that bring greater clarity, credibility, and unity to the sport’s rankings.”
An athlete rankings committee of professionals including Ruth Astle, Antony Costes, Renee Kiley, Danielle Lewis, and Jackson Laundry was formed to try and hit those objectives.
“I think we had over a year’s worth of meetings,” Laundry says. “The PTO board reviewed it, the investor board reviewed it, and for everyone to be happy was a pretty good accomplishment.”
The result is that the new rankings will still be an average points score across an athlete’s three best races, but each score is now determined by a mixture of race position (40%), strength of field (30%) and finishing time (30%).
ADVERTISEMENT
Each race will also be put into one of five tiers, Diamond, Platinum, Gold, Silver, and Bronze—Diamond tier events are the Ironman World Championships and all of the PTO races, including the Collins Cup.
“The number-one goal of the system was to make it transparent and something anybody could calculate – whether it’s complicated or not,” Laundry says. “It’s third-grade math. If you can do multiplication and addition, you can figure out what the points are when everybody has crossed the line.
“For that reason alone I’m really happy with it. I’m also happy that you can reasonably speculate what races to do to get the most points. There was previously a lot of anxiety among the pros, including myself, who thought they’d had a great race but didn’t know whether it would count for many points. At least now, we know if it’s a lower- or higher-tier race going in.”
ADVERTISEMENT
As Laundry says, there is complexity here. We’ve provided a more detailed breakdown, below, but while understanding the tiers and how the points drop off for each finishing position is relatively straightforward, as is calculating the “strength of field” component, the time-based element requires a hard look. Why not have something more straightforward?
“Initially, we looked at less complicated methods such as just using tiers or just strength of field, and problems came up with all of them,” Laundry adds. “We needed aspects of the system to cover any potential outlying events. Particularly in the lower-tier racing, you don’t always know what sort of field will show up. Someone could finish fifth one week and then second the next with a similar performance, but be 15 minutes behind the winner. If it is just scored on tiers, the points awarded doesn’t necessarily reflect the quality of that performance – nor that of the winner.”
With statistician Thorsten Radde running the numbers on historic results every time a new iteration was conceived, it’s worth noting that when the time aspect was removed the modeling showed the top 50 rankings hardly changed. “The way it works, it’s only a fraction of your score, so if you’re winning easily, you shouldn’t have to feel you have to crush yourself at the end of a race to get big points,” Laundry adds.
ADVERTISEMENT
One of the most contentious discussions was over race tiers: How many there should be, what gap should be between each and how much the points should drop off for each place. It’s notable that the Collins Cup, which can only be raced if you are top four in your region or you receive one of 12 captains’ picks, is a top-tier event. The PTO had faced criticism for even including in the original rankings because of its matchplay format and it being a limited field that’s not open to any professional.
“It was the race we talked about the most: Should it be seen as one race or treat each match as a separate race, or even not include it?” Laundry says. “But we didn’t want a situation where a long-course athlete, who might only do a handful or races a year, missed a race through injury and then chose to skip the Collins Cup [because it didn’t offer points].”
Perhaps understandably the commercial side of the PTO also held sway over what event would fit into what tier, and it’s hard to level too much criticism at an organization for putting its own flagship events in the top tier of its own rankings criteria.
Detailed ranking breakdown
The points allocation is split across three aspects:
ADVERTISEMENT
Race Position
(accounting for 40% of an athlete’s score)
A race’s tier sets its base points and the percentage drop-offs between finishing positions.
ADVERTISEMENT
Tiers are based on factors including race prize money, broadcast coverage, and commitment to supporting pro fields.
For example, a top (Diamond) tier event is the Ironman World Championship, with 100 points for the winner and a dropoff of 2% for each subsequent position.
The second (Platinum) tier event is Challenge Roth, with 95 points for the winner and a drop-off of 2%.
A third (Gold) tier event is Clash Daytona, with 90 points for the winner and a 5% drop-off in points for each position.
This is similar to how World Triathlon ranks its World Championship Series.
The races fit into the different tiers as follows:
| Tier | Description | Example Races | Base Points | Drop-Off % |
| Diamond | >=$500k | PTO Tour races, Collins Cup, IM World Championships | 100 | 2 |
| Platinum | >=$350k to <$500k | Ironman 70.3 World Championships, Challenge Roth, World Triathlon Long Distance World Championships | 95 | 2 |
| Gold | >= $75k to < $350k MD* >= $150k to <$350k FD** | Most IM & 70.3 Regional Championships, Challenge Family The Championship, Clash Daytona | 90 | 5 |
| Silver | >= $25k to < $75k MD* >= $50k to <$150k FD** | Most Challenge Family events††, many Ironman 70.3 and Ironman races, Clash Miami, some independent races | 80 | 8 |
| Bronze | >= $10k to < $25k MD* >= $10k to < $50k FD** | Some Challenge Family events, smaller independent races | 70 | 11 |
* MD= Races less than 4k / 120k / 30k (excluding those with 3.8km swim) ** FD = Races over 4k / 120k / 30k (including those with 3.8km swim)
† Scoring for match races such as the Collins Cup is to be confirmed
†† Takes into account Challenge Family World Bonus prize money
Strength of field
(accounting for 30% of an athlete’s score)
As the name suggests, the strength-of-field criteria is designed to reward athletes who put in stronger performances against tougher competition.
A race’s strength-of-field score is calculated on the average PTO ranking points of the top five athletes who start the race.
ADVERTISEMENT
Race Time Score
(accounting for 30% of an athlete’s score)
This is where it gets complicated.
Two baselines are set – the Baseline Score and the Baseline Time.
The Baseline Score is the average of Tier Base Points and strength of field score.
The Baseline Time is the average finishing time of the top five athletes (or less, depending on the number of athletes in the race)
An athlete’s final Race Time Score is calculated by starting with the Baseline Score and adding or deducting 6 points for every 1% that they’re faster or slower than the Baseline Time.
Example:
ADVERTISEMENT
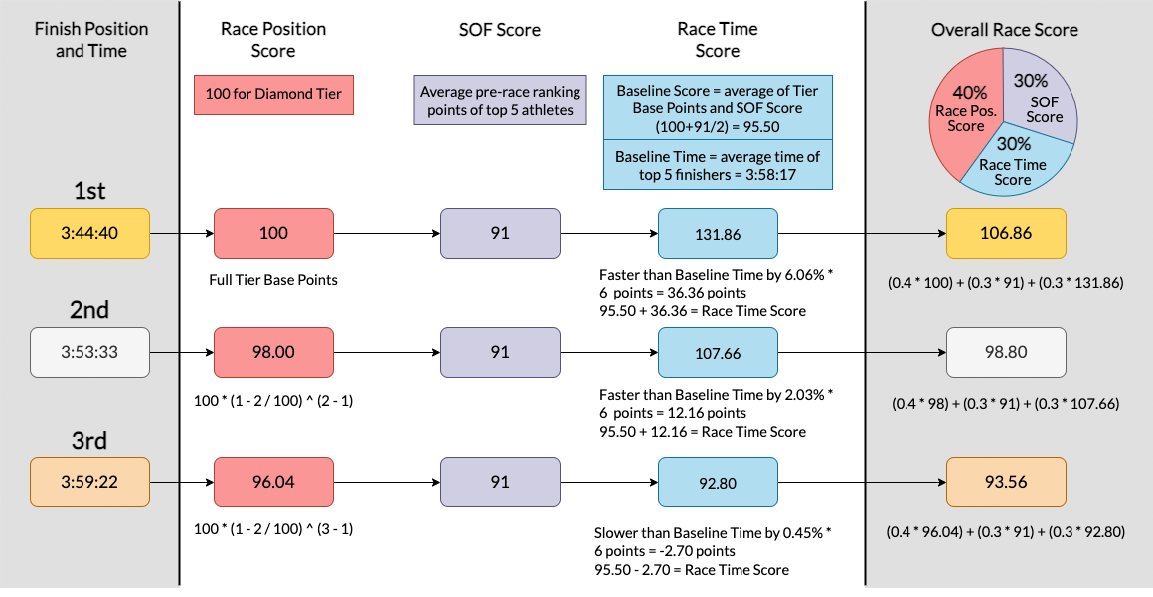
– Baseline Score = 95.5 (average of 100 Tier Base Points and SOF of 91)
– Baseline Time = 3:58:17 (based on average of top 5 finishers: 3:44:40, 3:53:33, 3:59:22, 4:04:41, 4:09:09)
Race Time Score for 1st place athlete = 131.86 (Faster than Baseline Time by 6.06% x 6 points = 36.36 points, 95.50 + 36.36 = 131.86)
Race Time Score for 2nd place athlete = 107.66 (Faster than Baseline Time by 2.03% x 6 points = 12.16 points 95.50 + 12.16 = 107.66)
Race Time Score for 3rd place athlete = 92.80 (Slower than Baseline Time by 0.45% x 6 points = -2.70 points. 95.50 – 2.70 = 92.80)
The overall race score is calculated as 40% of an athlete’s Race Position Score, 30% of the SOF Score and 30% of an athlete’s Race Time Score. The graphic, below, is probably the best way to illustrate.
Note: As with the old system, long distance athletes can pick up a full-distance bonus, so an athlete’s single best full-distance (over 3.8k swim, 120k bike and 30k run) score within the lower (bronze, silver, and gold) tiers gets a 5% bonus. This is to account for long-distance pros racing less and there being more top-tier events at middle distance.