Updated June 23, 2025 12:00AM
Women's 2024 Ironman World Championship Bike Count
Members of the triathlon industry spent hours tallying up what bikes, aerobars, components, wheels, and more gear that the fastest women in the world are using at the 2024 Ironman Championship in Nice.
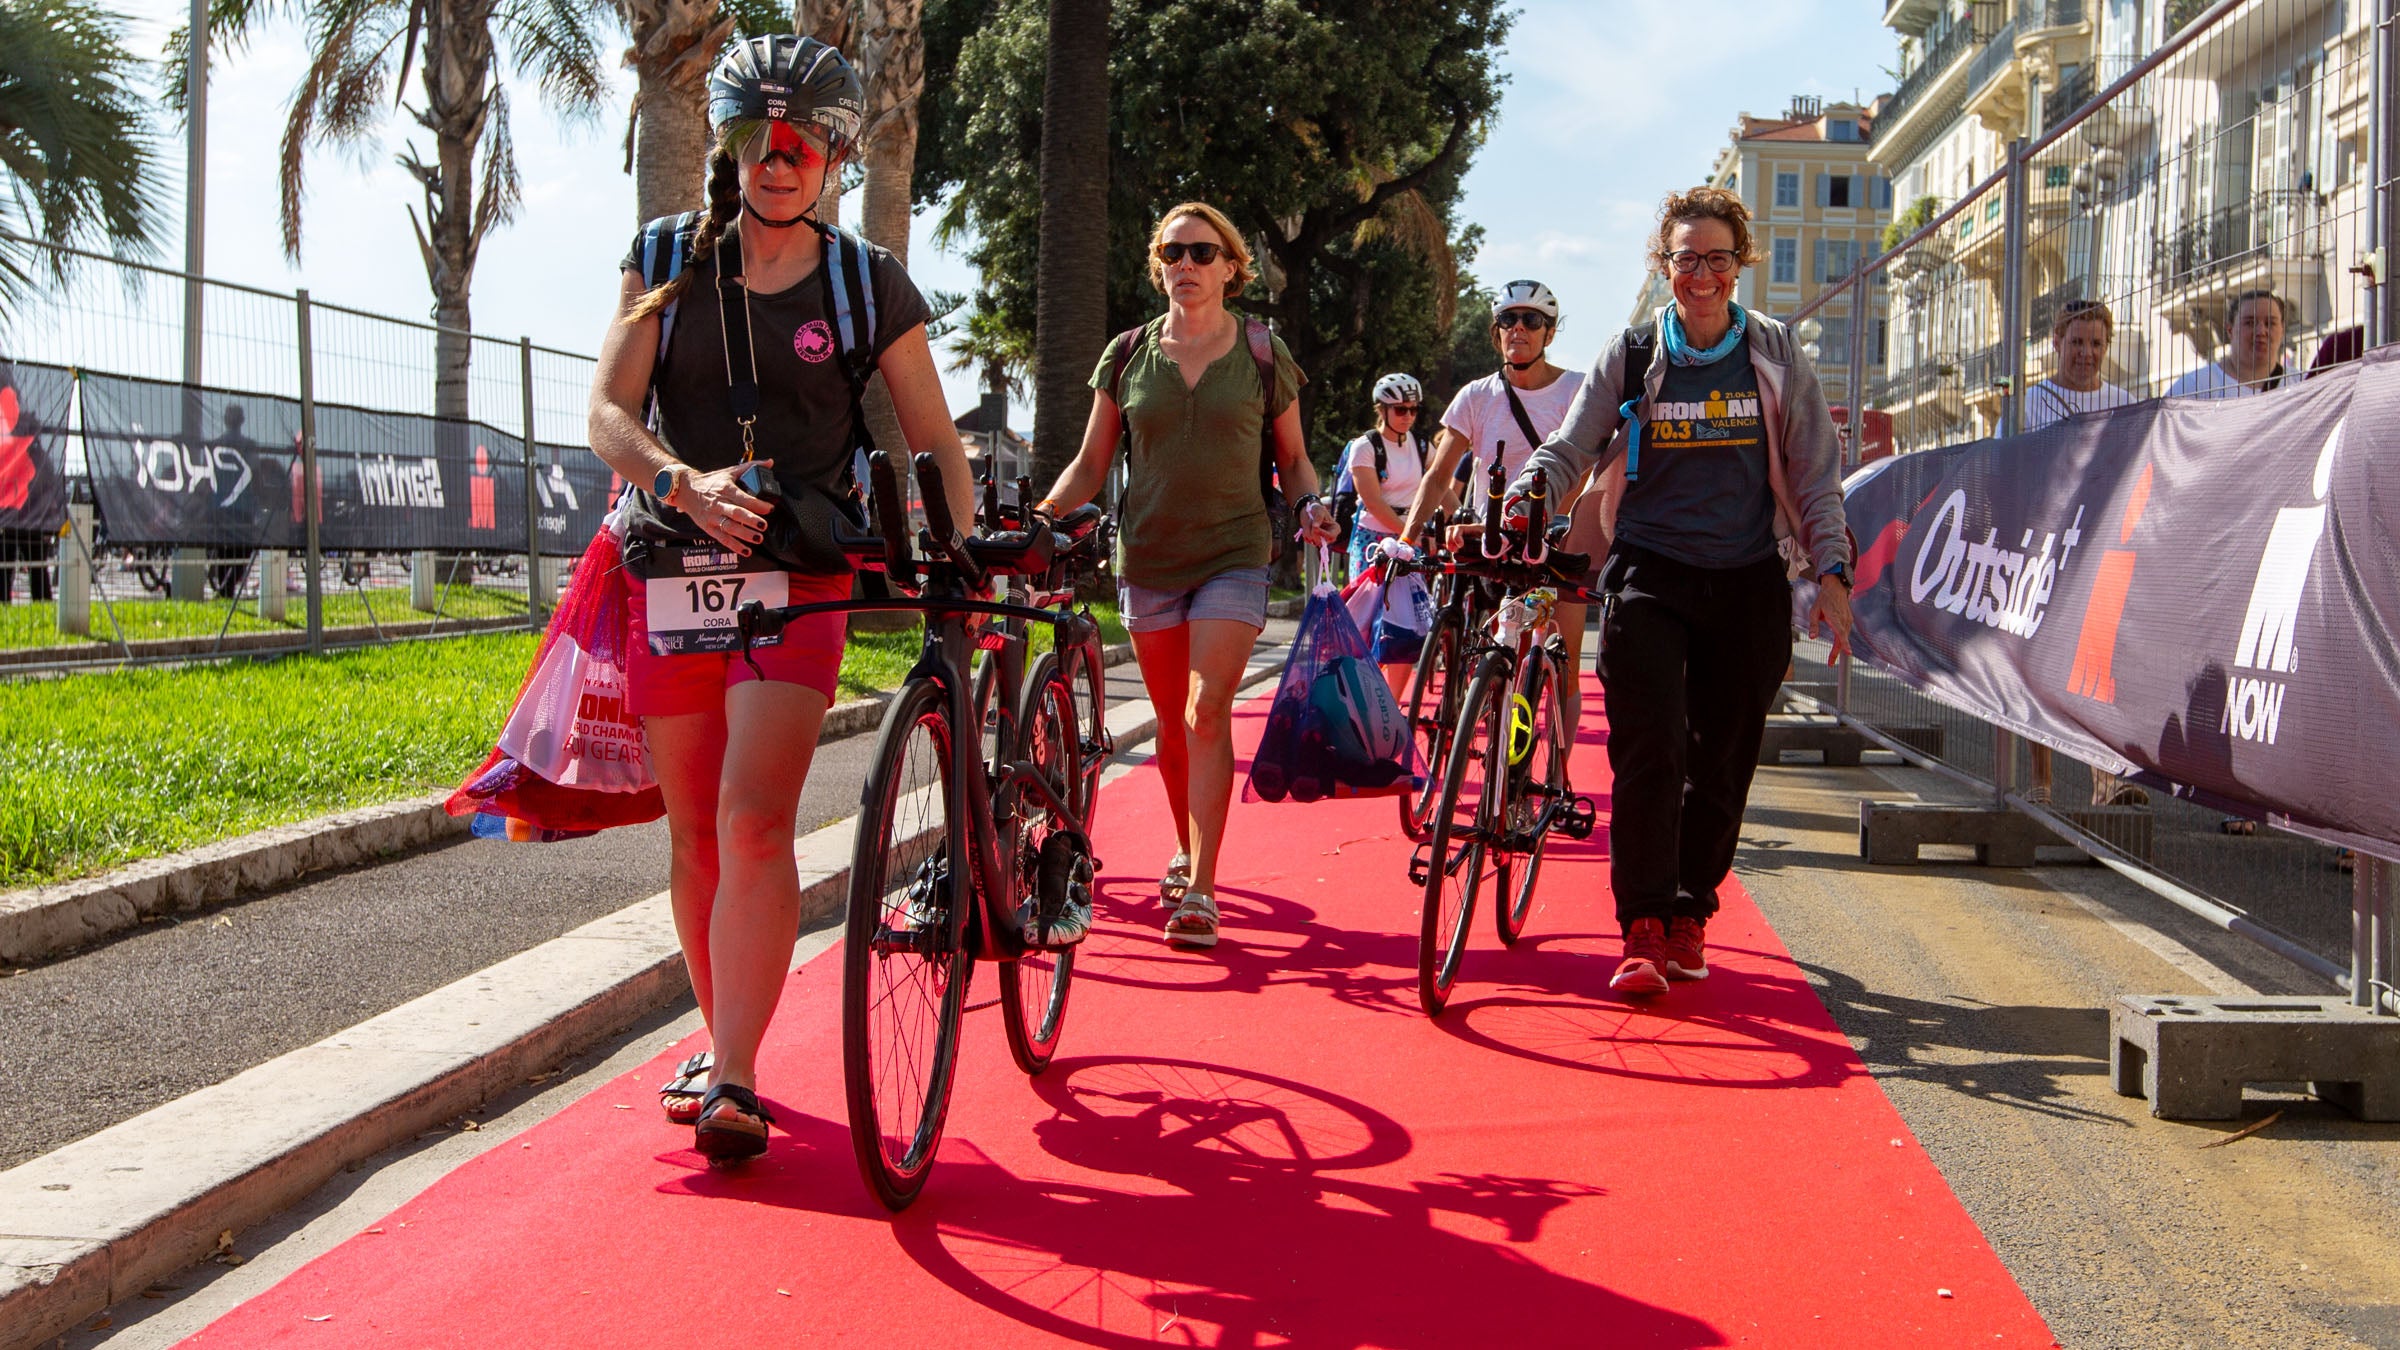
What kind of bikes are athletes riding at this year's Ironman World Championship in Nice, France? We present the results of the annual Ironman World Championship Bike Count. (Photo: Brad Kaminski/Triathlete)
2024 Women's Ironman World Championship Bike Count
What is the annual Ironman World Championship bike count, anyway? Well, it’s the best look at what type of gear the best long-course age-group athletes in the world are using on potentially the biggest day of their racing season.
Why does it matter? It gives fans of the sport and members of the industry a better idea of what top triathletes are using when it really matters to them, in the following categories: bikes, aerobars, components, wheels, power meters, pedals, saddles, front hydration, and rear hydration.
The Ironman World Championship bike count can signal trends in each of the above categories and – now that the event is split by gender and location (Nice and Kona) – it can show differences in gear choices for men, women, and continent, to some extent.
Read on for the results of hours of hard work from members of the triathlon industry on the ground in Nice, France, and contextual analysis based on years of carefully archived bike count data history. Also, a big thank you to Slowtwitch.com for coordinating this year’s bike count!
Note: This year, counters only recorded data across categories on brands that are currently in business, and graphs below only display selected data, while the tables beneath each section give more detail. In many instances we do not show all data recorded on tables if brands didn’t meet a specific count threshold.
2024 Women’s Ironman World Championship Bike Count: Bikes
Last year at the men’s race in Nice, we saw something in our bike count that hadn’t happened in recent history: Cervelo fell from the top spot on the bike count, losing by 4% to Canyon. This was surprising to some, but as Canyon has a heavy presence in Europe – as opposed to Cervelo’s bigger presence in North America, where Ironman World Championships have been held since the event began – conditions seemed prime for a Euro upset.
This year, however, Cervelo regained its top spot in the women’s Nice event, beating out second-place Trek by a mere 2% and Canyon in third, less than 4% down from Cervelo. It was a righting of the ship, but only barely. This is also a very different story than the women’s race in Kona last year, where Cervelo took the top spot over Trek by a whopping 10%.
ADVERTISEMENT
In terms of other big movers, it looks like Quintana Roo seems to be a favorite with female Ironman World Championship racers, as it was fourth on the list this year in Nice (it was third last year with women in Kona, over Canyon). Quintana Roo was a distant 12th place with men in Nice in 2023, only capturing 3% of the field, as opposed to 8% with women in Nice in 2024. Felt also continues to post low numbers in Nice (for both men and women) compared to nearly double the share with women in Kona in 2023.
| Cervelo | 17.34% |
| Trek | 15.41% |
| Canyon | 13.76% |
| Quintana Roo | 8.65% |
| Specialized | 7.89% |
| LIV | 7.61% |
| BMC | 5.32% |
| Felt | 4.68% |
| Argon 18 | 4.40% |
| Scott | 3.21% |
| Cannondale | 1.83% |
| Pinarello | 1.83% |
| Giant | 1.74% |
| Orbea | 1.47% |
| Cube | 1.19% |
| Factor | 0.83% |
| Ventum | 0.46% |
| Ridley | 0.37% |
| Ceepo | 0.28% |
| Dimond | 0.28% |
| KU | 0.28% |
| Parlee | 0.28% |
| Willier | 0.28% |
2024 Women’s Ironman World Championship Bike Count: Aerobars
As is often the case, not much changes with aerobars – likely because many triathletes stick with the aerobars that come stock on their bikes. As we’ve seen for a very long time, Profile Design remains at the top of the list this year with women in Nice with roughly the same share (27%) as we saw last year with men in Nice. The women in Kona were more likely to ride Profile Design (37%), but other numbers from secondary brands like Trek/Bontrager, Zipp, and Vision remain roughly the same year-to-year, between locations and gender.
ADVERTISEMENT
Much like last year’s aerobar count in Nice, we saw a very large percentage of athletes riding road bikes with drop bars (13% of women in Nice 2024 and 8% of men in Nice in 2023), showing that female Ironman World Championship racers are more likely than their male counterparts to ride a road bike on the unique Nice bike course. (Only 1% of female athletes in Kona last year used drop bars, for comparison.)
| Profile Design | 27.30% |
| Dropbar Only | 13.35% |
| Other | 10.08% |
| Bontrager/Trek | 8.96% |
| Zipp | 6.03% |
| Giant/Liv | 5.08% |
| Vision | 4.91% |
| Canyon | 4.74% |
| Specialized | 3.45% |
| 3T | 2.76% |
| Cervelo | 2.58% |
| Argon 18 | 1.89% |
| 51 Speed Shop | 1.64% |
| Aero Coach | 1.38% |
| Drag2Zero | 1.38% |
| Deda | 1.21% |
| Sync | 0.69% |
| Tririg | 0.69% |
2024 Women’s Ironman World Championship Bike Count: Components
Shimano is never in any danger of falling from the top spot when it comes to components – capturing 77% of the share with women this year in Nice, almost exactly like last year in Nice with men and last year in Kona with women. Even more than aerobars, triathletes are most likely to keep the components that come on their bike, so it’s more of a sign showing how much Shimano comes as OEM (a lot).
| Shimano | 76.86% |
| SRAM | 22.57% |
| Rotor | 0.33% |
| FSA | 0.25% |
2024 Women’s Ironman World Championship Bike Count: Wheels
Much like bike brands, wheel choices seem to be a little more regional: Men last year in Nice chose DT Swiss over all other brands with 20% of the overall share (disrupting Zipp for the first time in memory); women chose DT Swiss by roughly the same amount (21%) as the top wheel in Nice this year. However women in Kona last year rode Zipp overwhelmingly, nearly doubling the share over DT Swiss (18% had Zipp, 9% had DT Swiss).
Reynolds also seemed to be more popular with women in both Nice this year and Kona last year, while women in Nice chose Bontrager (13%) by a far greater margin than men in Nice in 2023 (7%) – and more than women in Kona last year (9%).
| DT Swiss | 22.72% |
| Zipp | 16.24% |
| Bontrager | 13.48% |
| Reynolds | 7.11% |
| Roval | 7.01% |
| Giant | 6.16% |
| HED | 6.16% |
| Mavic | 4.67% |
| Vision | 4.56% |
| Enve | 4.46% |
| Reserve | 2.76% |
| Hunt | 2.34% |
| Swiss Side | 2.35% |
| Fulcrum | 2.02% |
| Flo | 1.27% |
| Campagnolo | 1.17% |
| FFWD | 1.06% |
| Shimano | 1.06% |
| Cadex | 0.96% |
2024 Women’s Ironman World Championship Bike Count: Power Meters
Sadly, we don’t have data on power meters from Nice last year, but numbers in for the women’s race at Kona 2023 look very similar to the numbers in Nice this year. Garmin is at the top of the list with 28% in Nice 2024, only a slight drop from Kona in 2023 (32%). However second-place Assioma has a substantially greater share in Nice this year (28%) than its third-place spot behind Quarq in Kona last year (19%). Stages also has a big jump in share in Nice this year, with 6% (2% in Kona 2023). 4iii has a similar leap, sitting in fifth place in Nice 2023.
| Garmin | 28.52% |
| Assioma | 27.86% |
| Quarq | 19.45% |
| Stages | 6.31% |
| 4iii | 5.39% |
| Rotor | 4.34% |
| Shimano | 2.50% |
| Wahoo | 2.10% |
| FSA/Vision | 1.58% |
| SRM | 0.66% |
2024 Women’s Ironman World Championship Bike Count: Pedals
Pedals are another category that we don’t have Nice data from 2023, but we do know that female racers in Nice this year still prefer Shimano, Look, and Garmin – in that order. There are 4% fewer Shimano pedals and 7% fewer Look pedals in Nice this year than we saw at the women’s race in Kona 2023, but not much else is different.
| Shimano | 30.49% |
| Look | 26.12% |
| Garmin | 18.73% |
| Assioma | 14.76% |
| Speedplay | 8.19% |
| Powertap | 1.05% |
| Time | 0.65% |
2024 Women’s Ironman World Championship Bike Count: Saddles
Saddles are a category where we have very little recent historical data, but we do know that ISM has a commanding lead over Selle Italia and Specialized who are second and third place, respectively. After that group, Bontrager and Fizik are quite close with roughly 7%.
| ISM | 33.65% |
| Selle Italia | 18.76% |
| Specialized | 15.51% |
| Bontrager | 7.86% |
| Fizik | 7.02% |
| Prologo | 5.14% |
| Cobb | 4.09% |
| Gelomized | 2.94% |
| Shimano | 2.41% |
| SMP | 1.57% |
2024 Women’s Ironman World Championship Bike Count: Front Hydration
Front hydration is an interesting category because of the growing popularity of integrated, in-frame hydration systems that typically occupy that between-the-arms real estate – though many athletes have both, of course. This year we still see Profile and Xlab with the top spots, but with a significant market loss to integrated systems when compared to Kona in 2023. Both Profile and Xlab have lost between 10-18%, while integrated systems have increased by 12%. Bontrager and old favorite Speedfil have both made significant gains when compared to Kona in 2023.
| Profile Design | 33.41% |
| Xlab | 25.23% |
| Integrated | 19.63% |
| Bontrager | 8.58% |
| Speedfil | 7.48% |
| Giant | 4.67% |
2024 Women’s Ironman World Championship Bike Count: Rear Hydration
Rear hydration systems are another category with a scarcity of recent, meaningful data, but Xlab has a commanding lead over second-place Profile Design with 51% share and 30% share, respectively. Other brands are substantially behind with only a marginal share in comparison.
| Xlab | 51.66% |
| Profile Design | 30.07% |
| Elite | 6.83% |
| Integrated | 4.61% |
| Bontrager | 1.85% |
| Giant | 1.66% |
| Fizik | 1.29% |
| Tacx | 1.11% |
| Specialized | 0.92% |
Vive la France! Visit our Nice Central hub for news, analysis, history, photo galleries, and so much more – new stories added daily from our team on the ground at the women’s 2024 Ironman World Championship.