Updated July 10, 2025 02:46PM
Are Ironman XC Athletes Faster Than The Rest of Us?
We asked our expert tri data scientist to dig into the results of our sport's wealthiest 1%.

Are Ironman XC athletes that different from the rest of us (on the race course)?
Since the release of the New York Times Magazine story, “How the 1% Runs an Ironman,” much has been said in the last couple of weeks about Ironman XC. Ironman XC, or “Executive Challenge,” is the business-class version of Ironman triathlon: convenient accommodation next to the start line, priority start, concierge service, and on and on. These athletes get to enjoy the Ironman experience while minimizing a lot of the logistical pain—for a corresponding price, at least one or two orders of magnitude what most other triathletes are used to paying.
The big question, then: Does it impact the way they race?
Same same but different
Ironman XC is only available for a select number of races, both for Ironman and 70.3. In 2022 this included the three different World Championships—Ironman World Championships St. George, Kona, and 70.3 World Championships St. George—and an additional nine races, all of which were in North America—save for Copenhagen—for a total of 12. Ironman XC is a very select club, so much so that the average number of XC athletes at each event, excluding Kona, was only nine.
ADVERTISEMENT
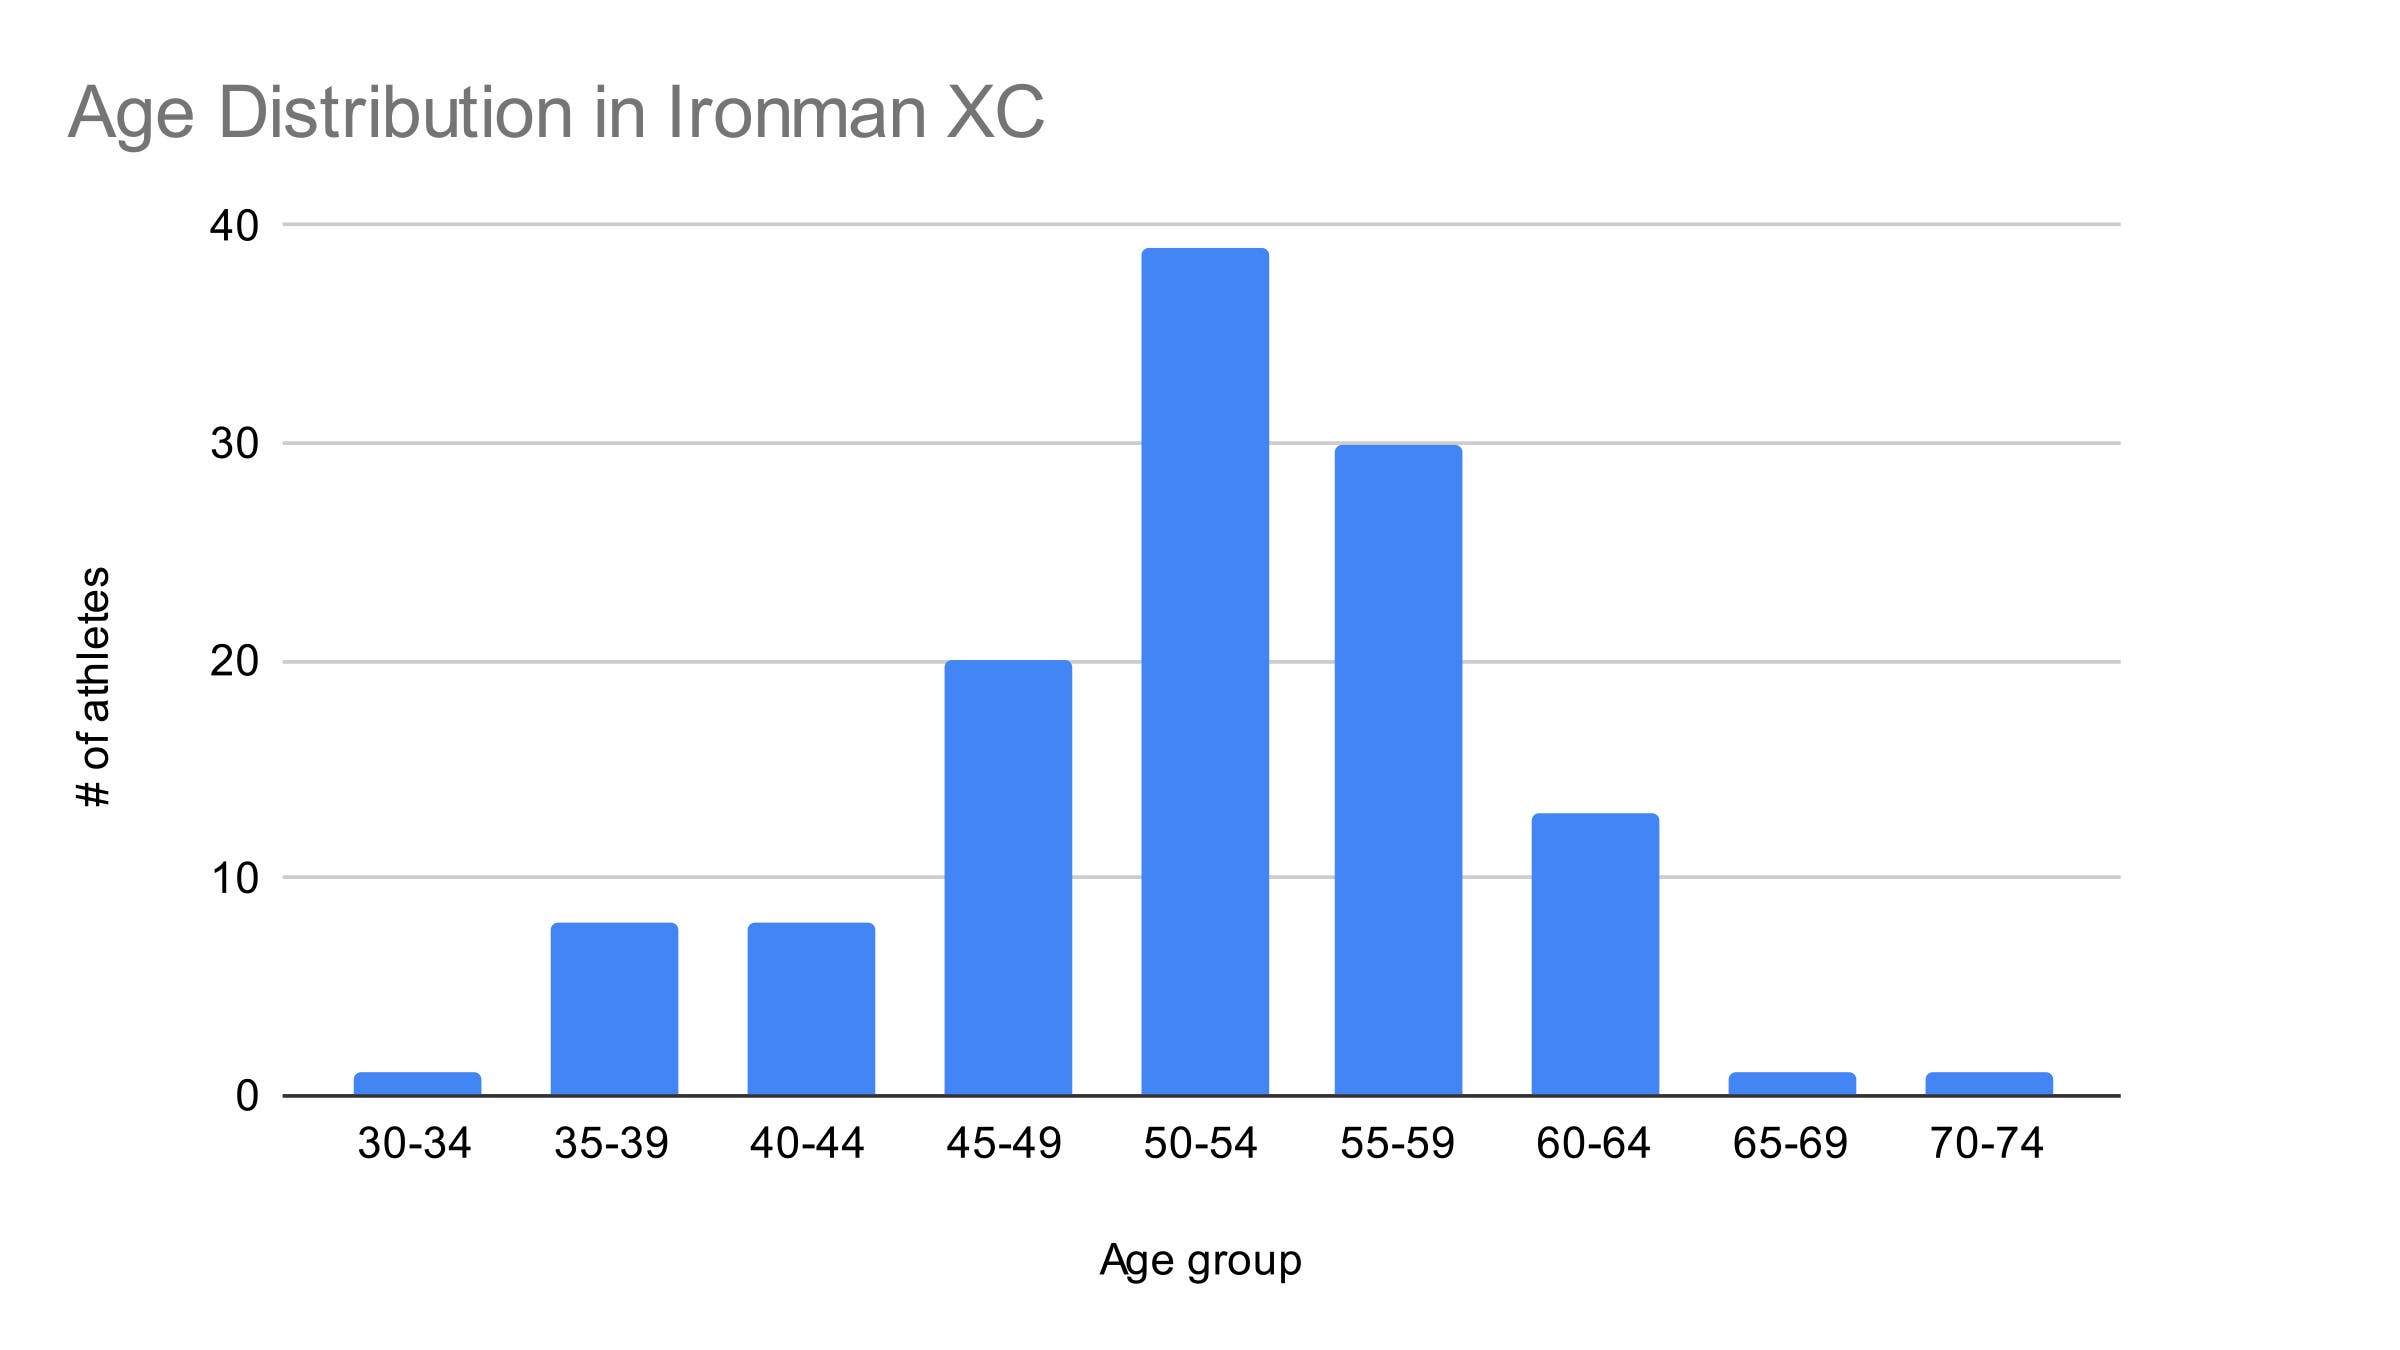
In terms of profile, we can see from the age distribution below that these triathletes are slightly older than the norm. For regular triathletes, the largest group tends to be the 45-49 group closely, followed by the 40-44 and 50-54 age group. With XC it shifts one age group to the right.
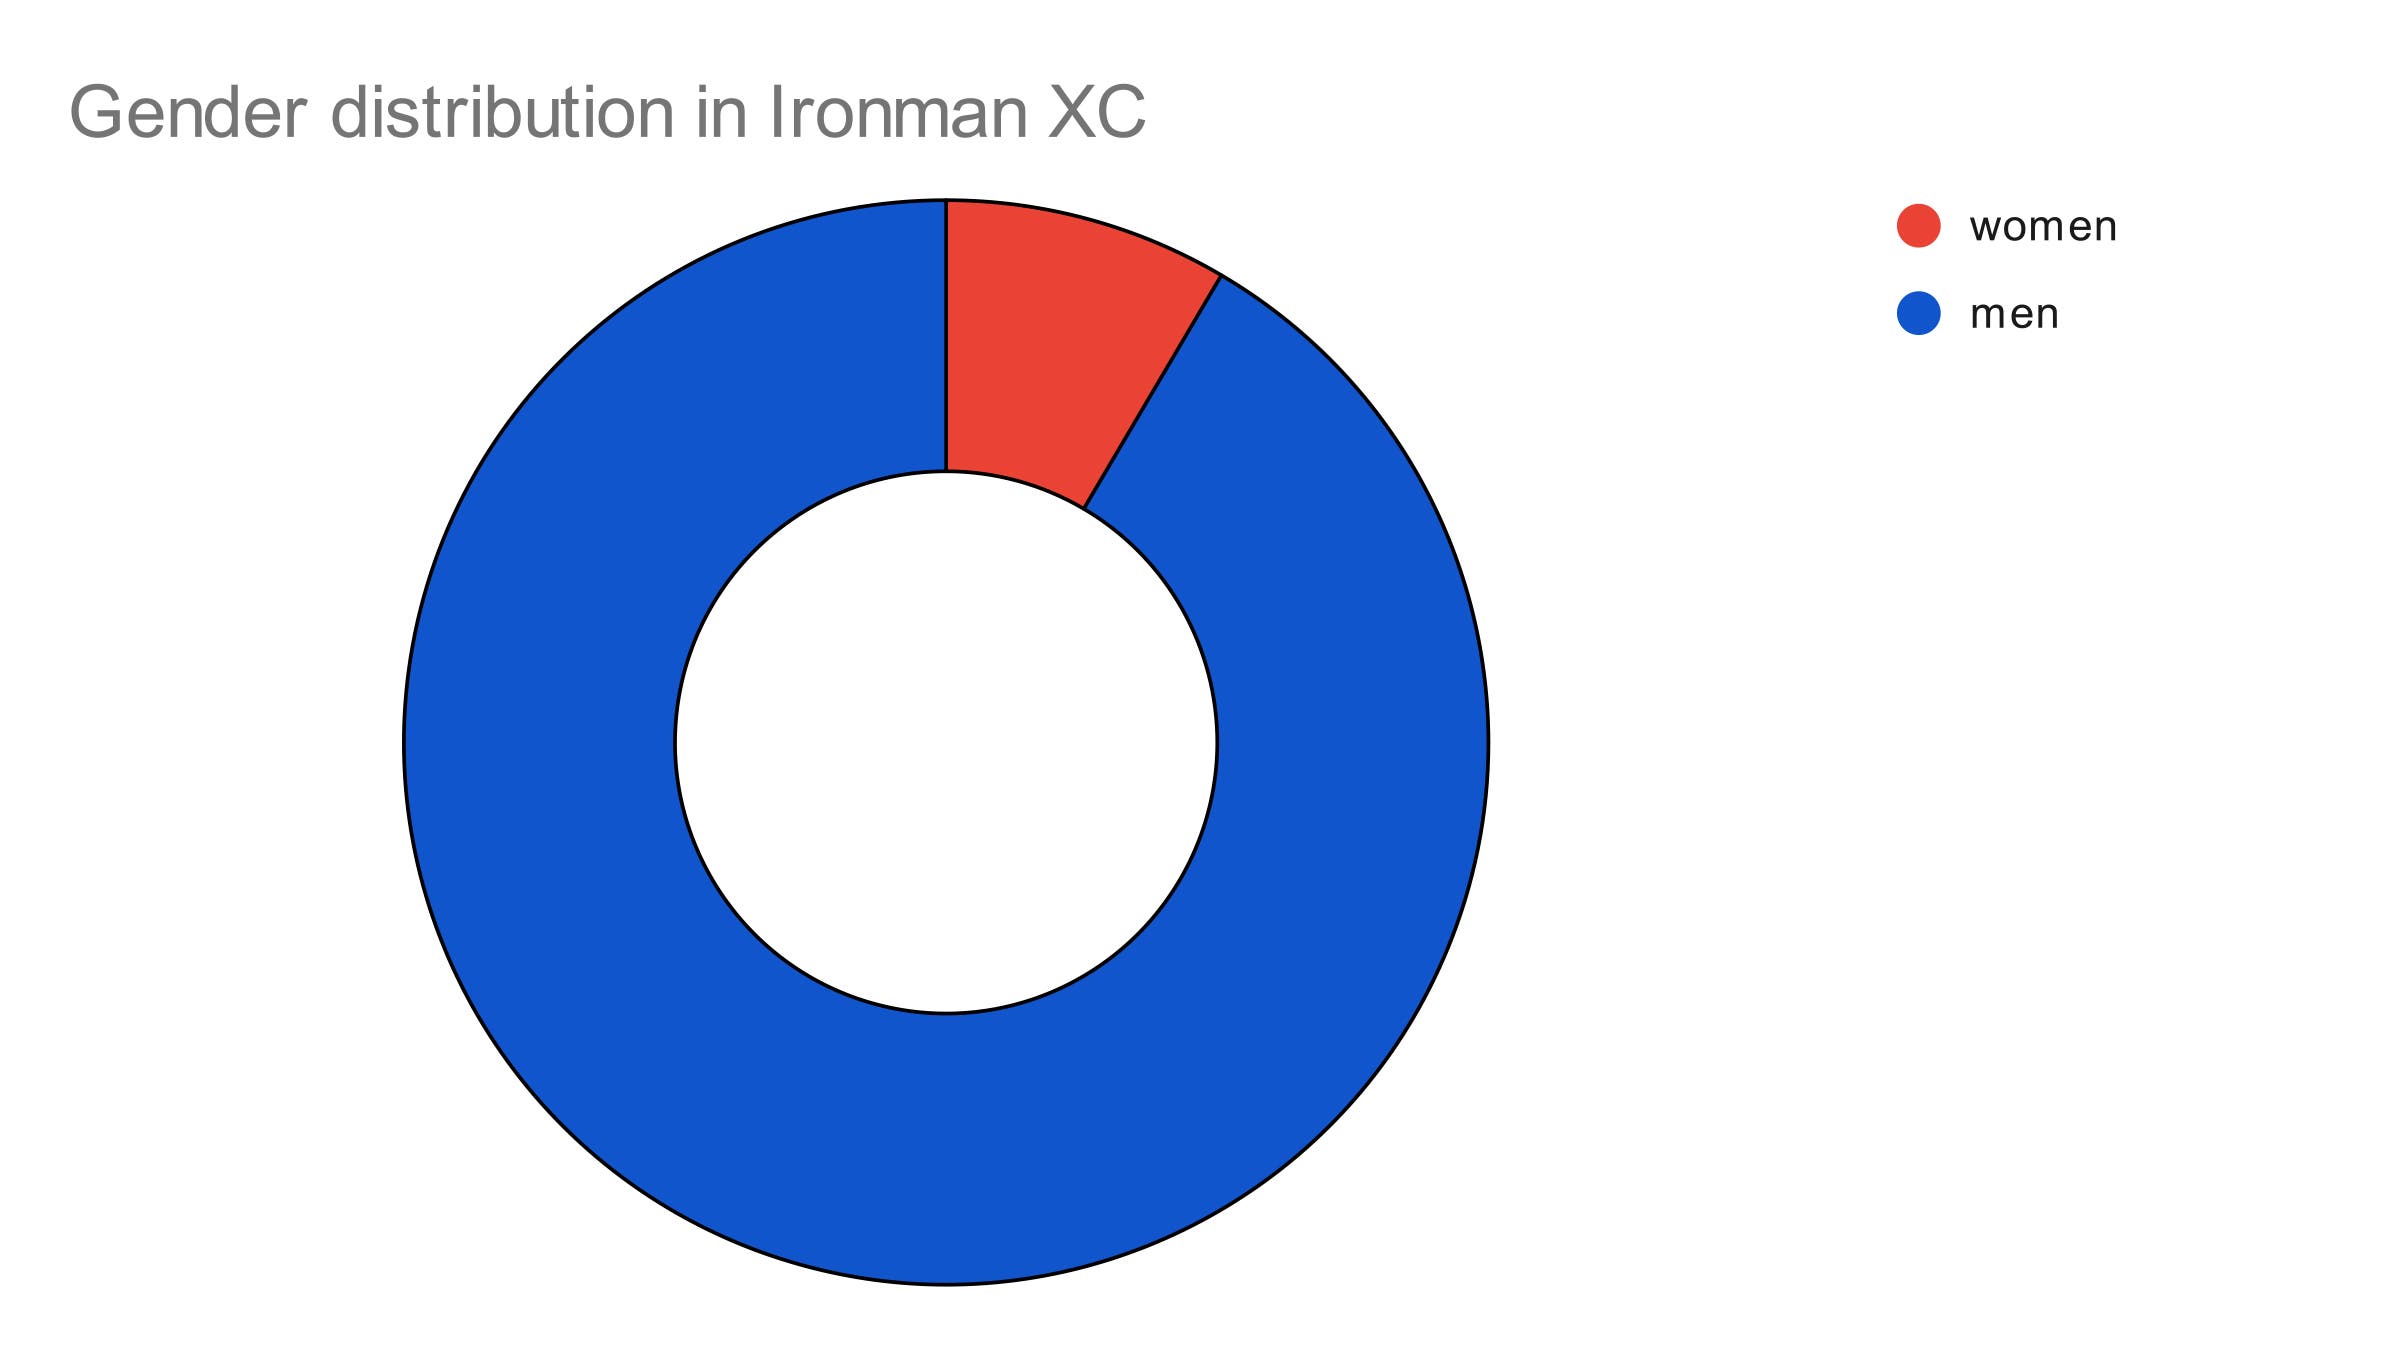
As far as gender goes, XC is composed of mostly men. Of the 118 unique XC racers in 2022, only 10 were women—that’s 8.5% women of the XC group against the 20% female Ironman participation number (according to a 2020 IM demographic survey).
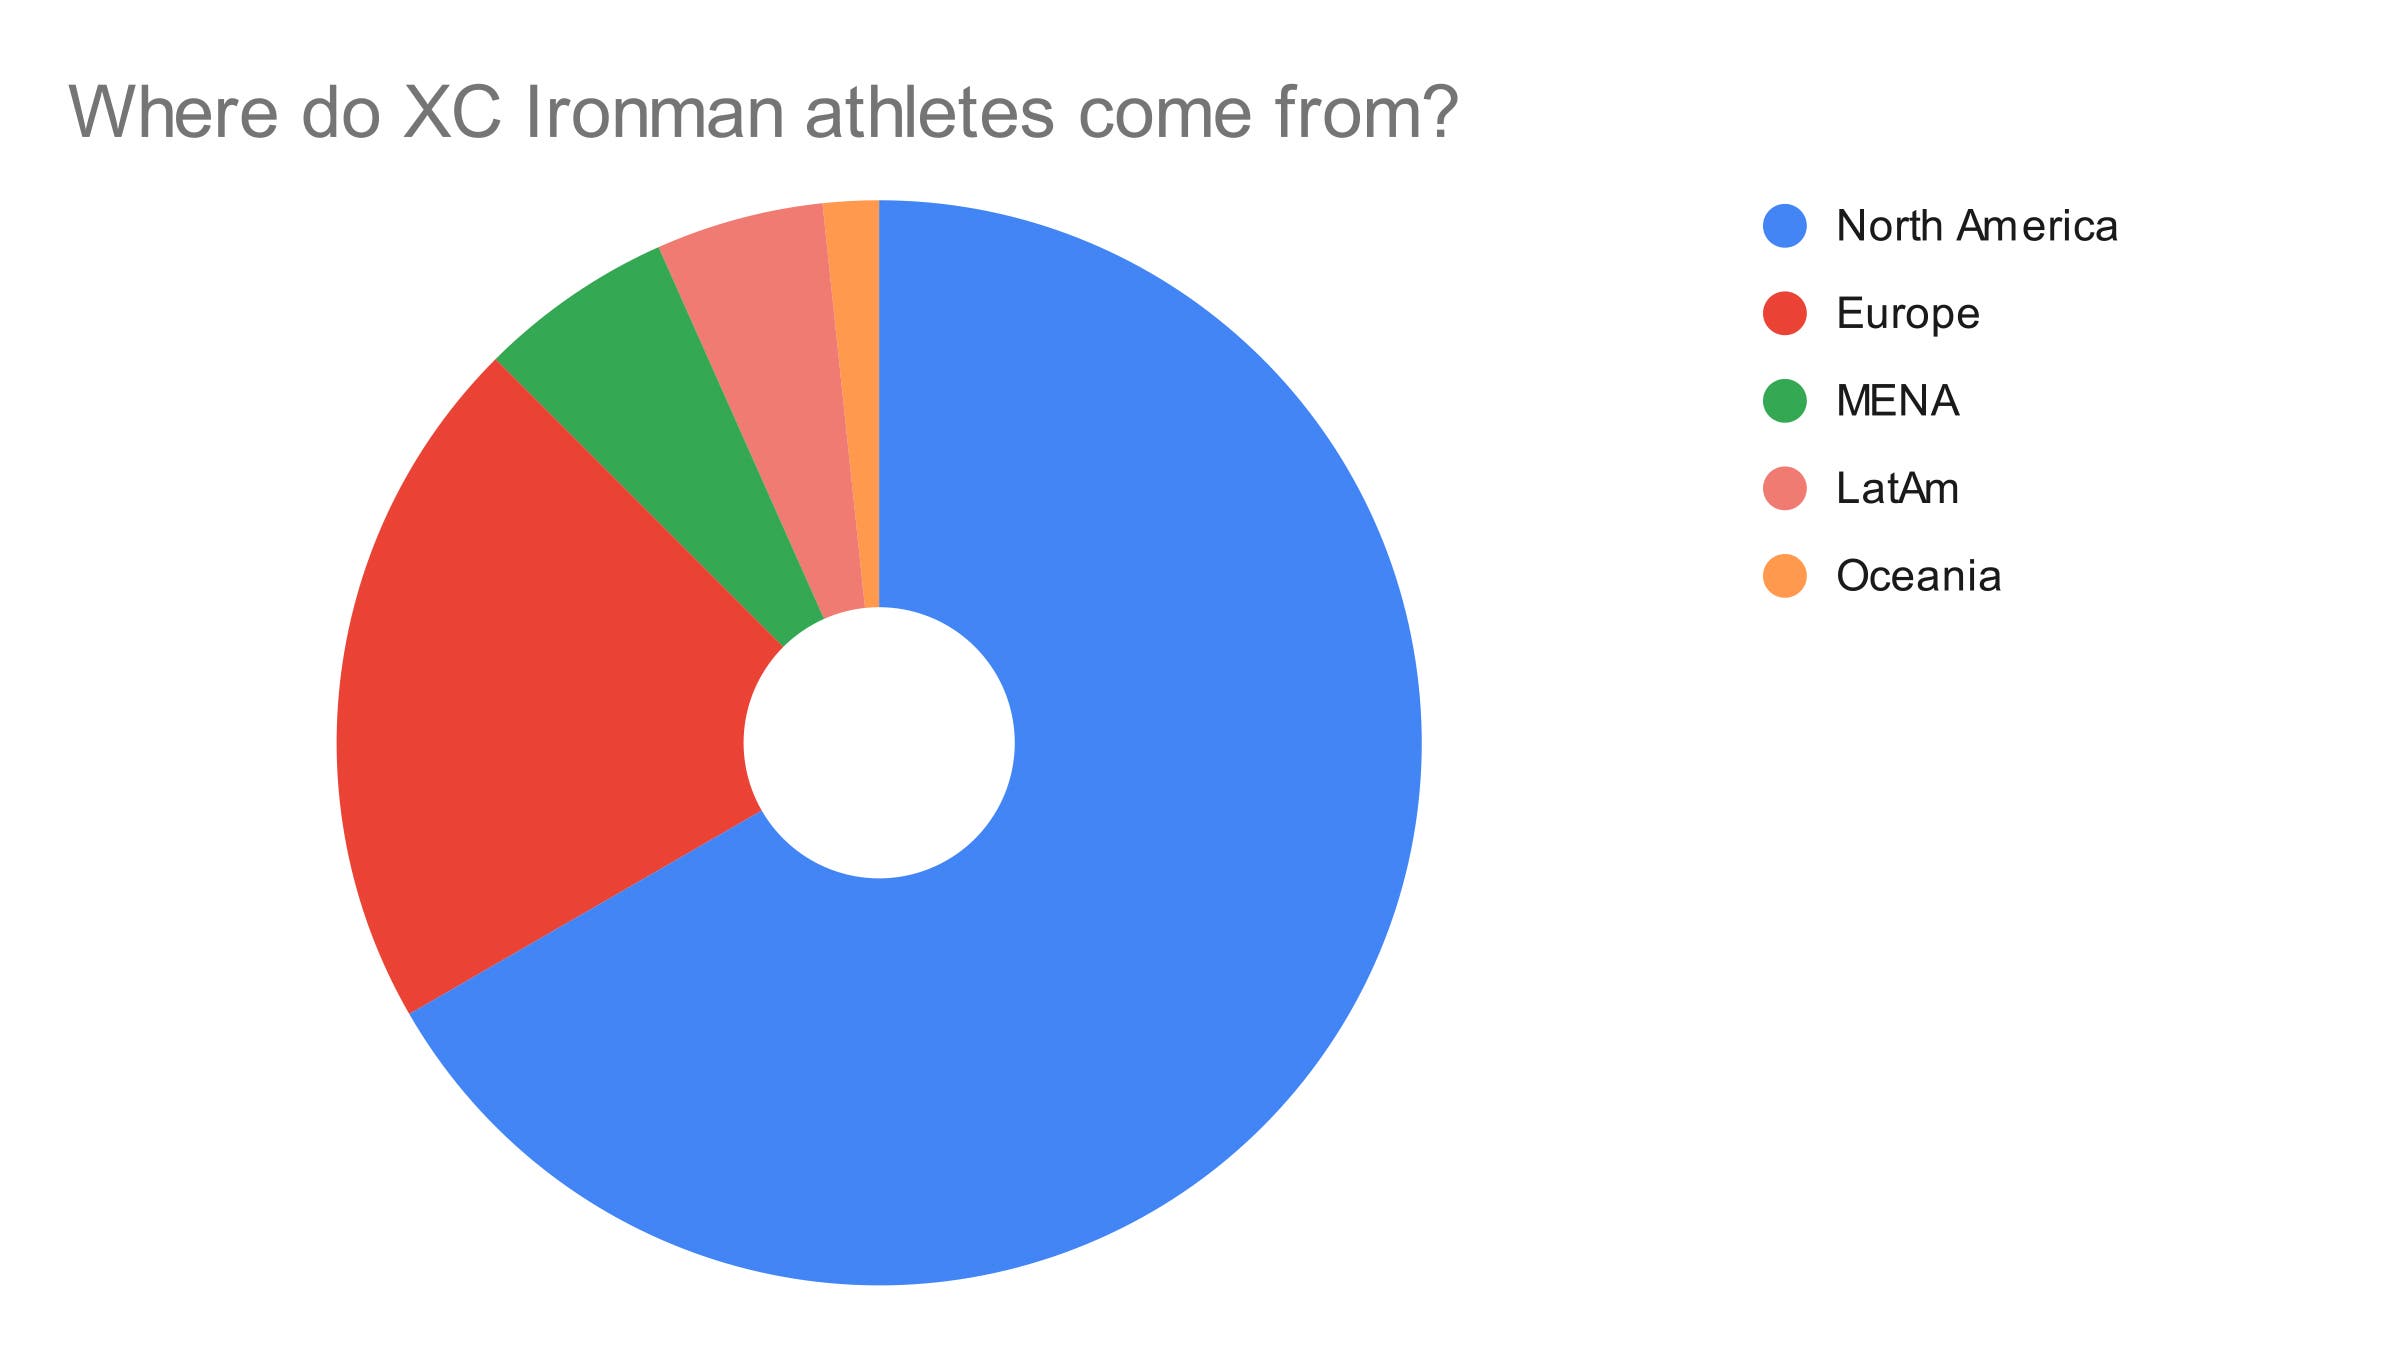
As for the geographic distribution, the overwhelming majority of triathletes were from North America (66%), followed by the Europeans (21%). It’s unclear if this is because most of the races were located in North America, or if the selected races were in North America because XC attracts mostly a North American crowd. Chicken or the egg, for sure.
Finally, we can definitely say that XC is a lifestyle for some. Nearly 40% of the athletes raced under XC more than once. Three of the XC athletes competed as XC in four different races this year. Those are some good customers!
ADVERTISEMENT
How did they fare?
With all the additional money these athletes are willing to invest in their training and in optimizing their race experience, how do XC triathletes actually perform?
Starting with the 70.3 races, the graph below plots XC triathletes’ finishing time versus their division (age group) rank.
ADVERTISEMENT
(Ed. Note that the Y axis is on a log scale to more easily see the results.)
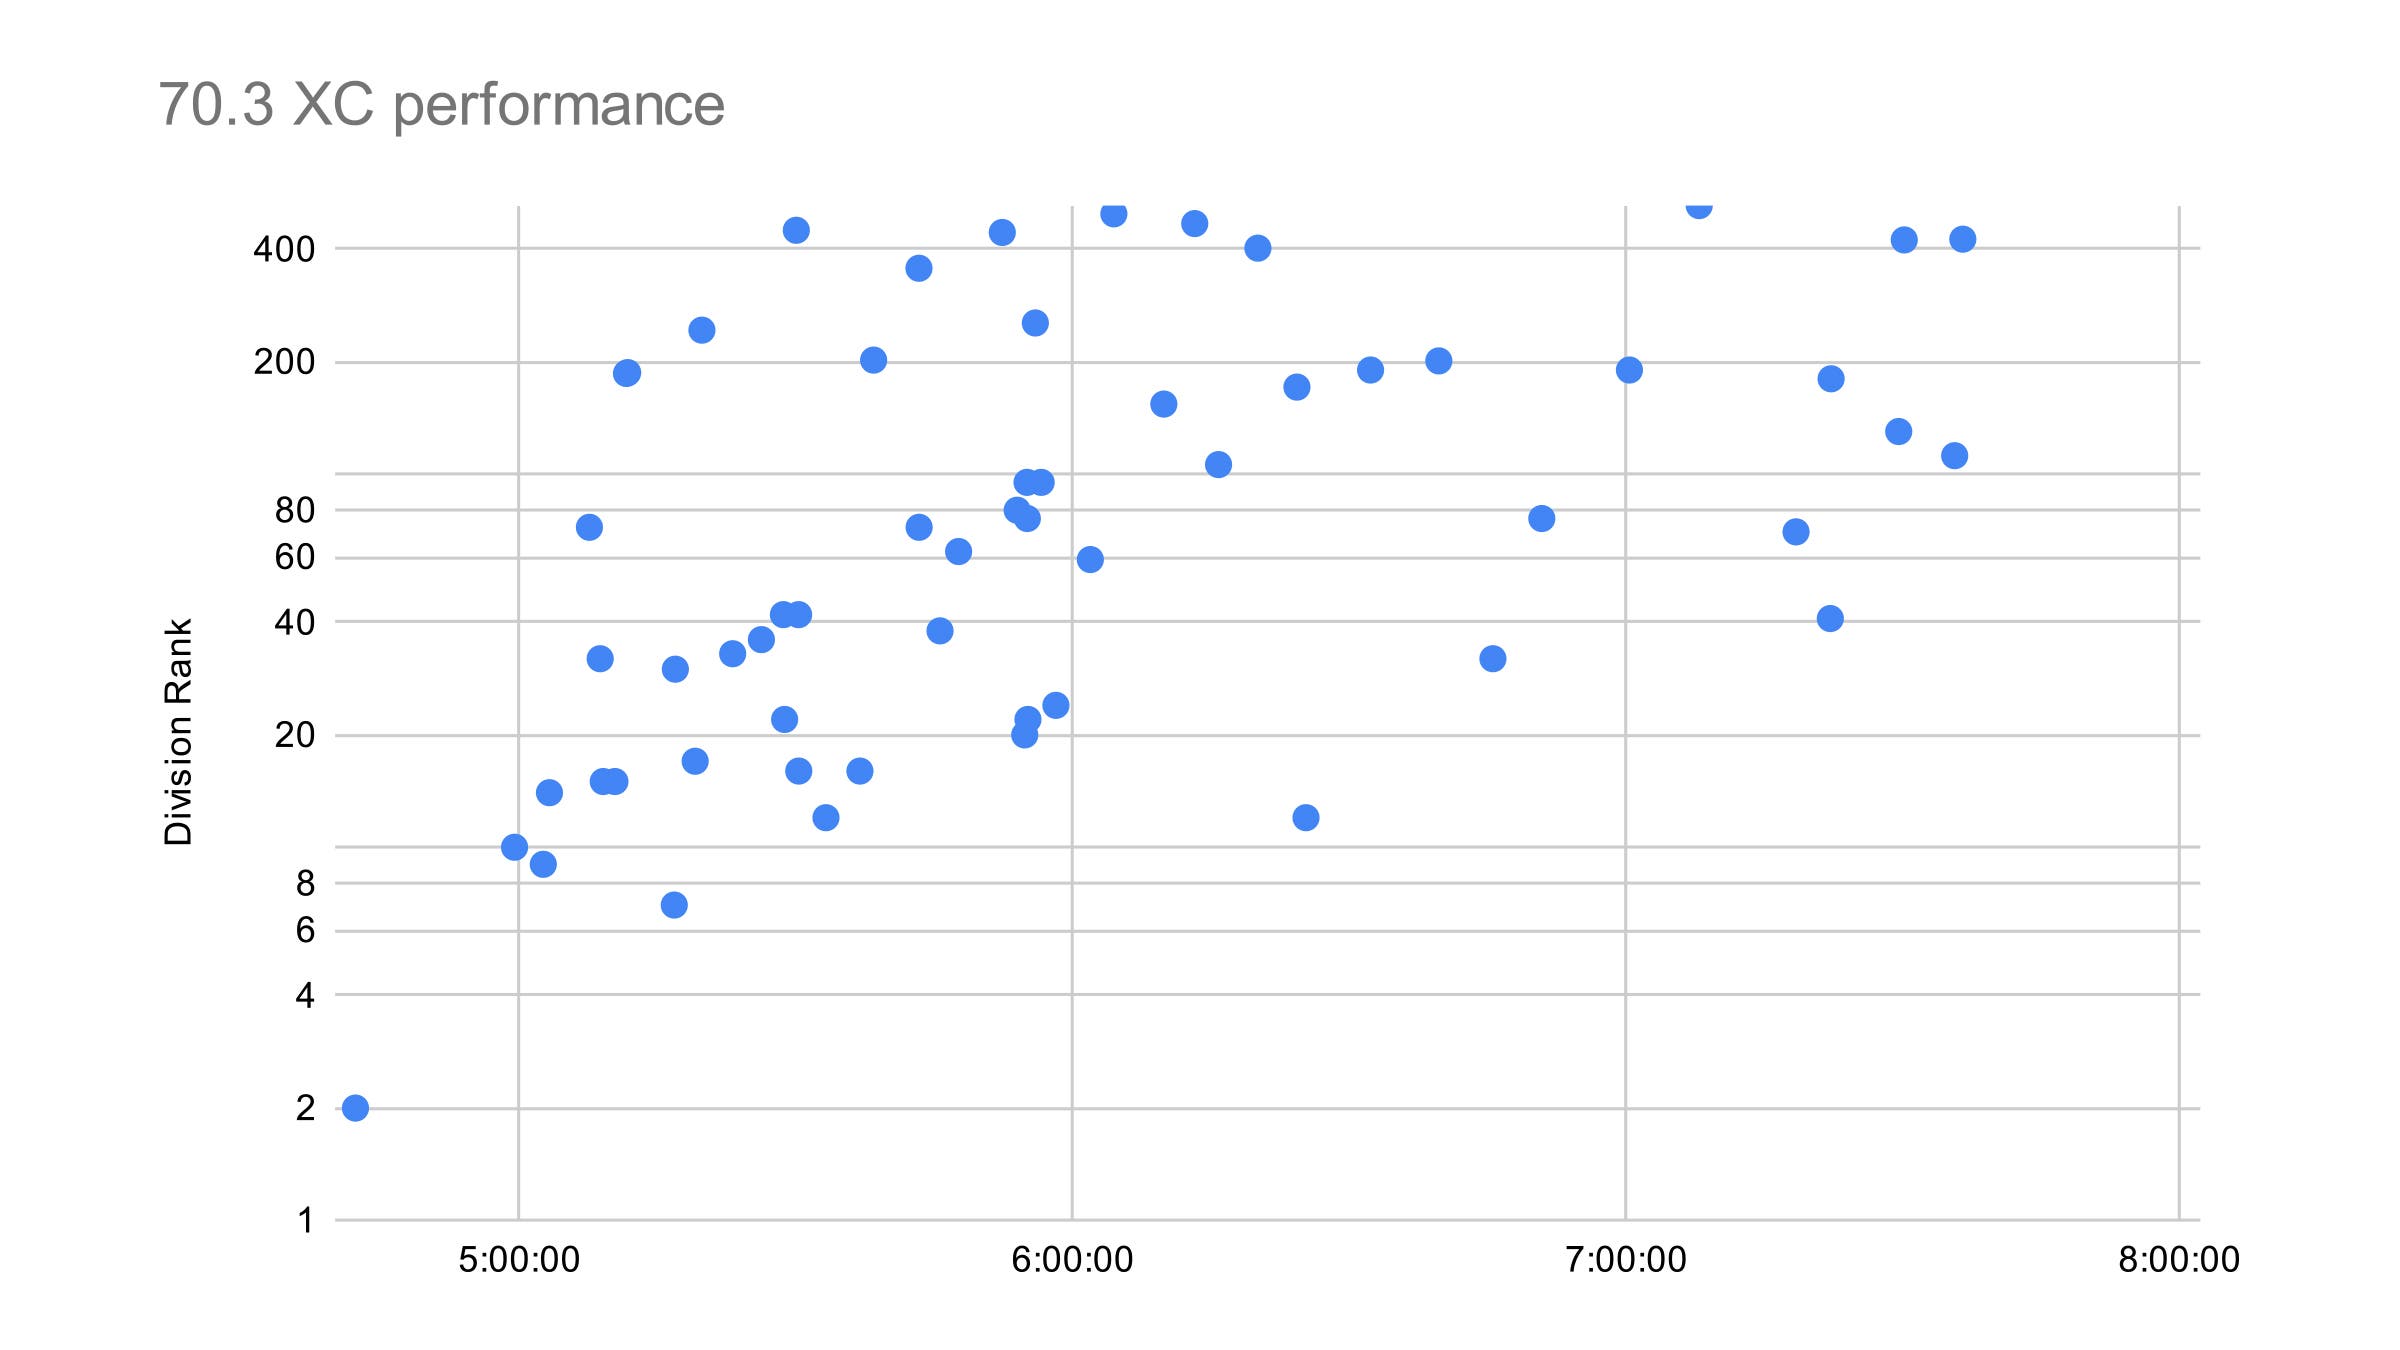
As we can see, there were only two instances of triathletes finishing under the magic 5-hour mark—that happened in Mont Tremblant and Oceanside. The majority of the racers, though, finished between 5 and 6 hours, with the mean at 5:58 for all 70.3 races.
In terms of ranking, in general those were fairly middle-of-the-table. Only a small handful managed to get in the top 10 of their age group in their respective races, and only one managed a podium spot. The overall average rank, including the World Championships, was 75th place. If we exclude the World Championships race, where most athletes there qualified by being top performers in other races and is perhaps not representative of the general Ironman population, then the number goes up to 59th place.
ADVERTISEMENT
For Ironman races we see a similar story. With an average finishing time of 12:59, only four triathletes managed to finish in less than 10 hours. As for rankings, it’s slightly more complicated than with 70.3. At the iron-distance, none of the XC triathletes managed to get a podium, and three of them made it onto the top ten.
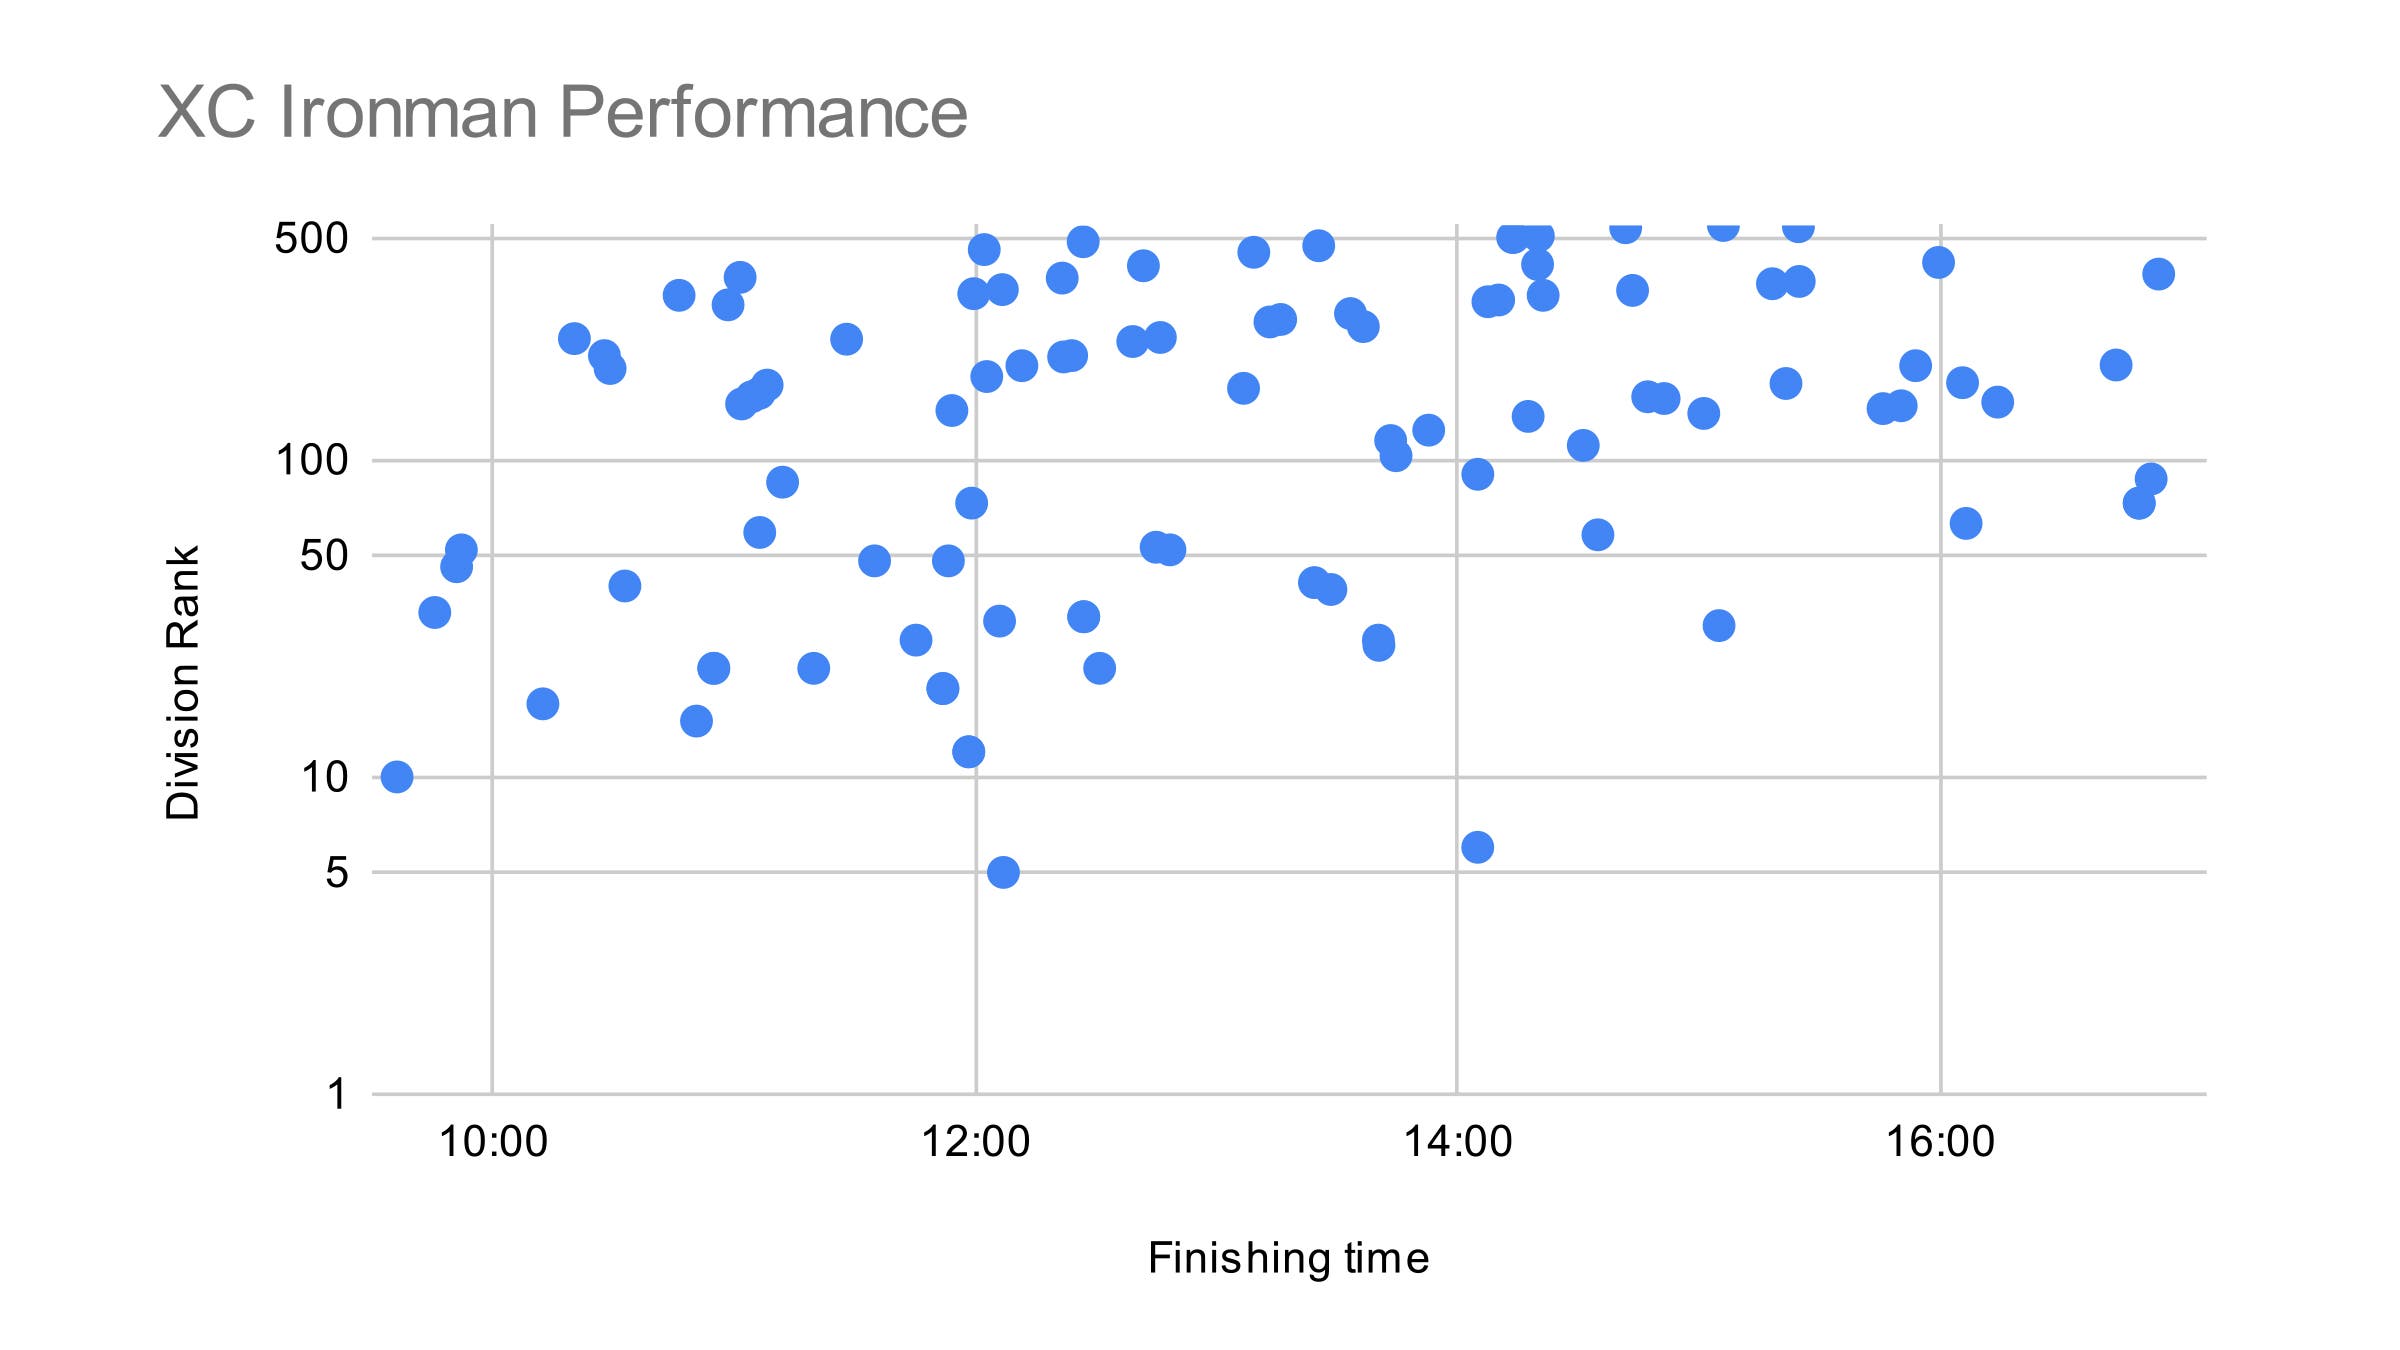
If we include Kona, where the average ranking for XC was 291st place, then the overall average division rank drops to 94th place. However, if we exclude Kona from the calculation, then the average moves up to 61st. This statistic is probably the most telling in assessing the level that XC triathletes are at—firmly midpack.
| Race | Average Time | Average AG rank |
| 70.3 Chattanooga | 5:59:08 | 85 |
| 70.3 Mont Tremblant | 5:53:58 | 57 |
| 70.3 Oceanside | 6:09:46 | 75 |
| 70.3 Puerto Rico | 5:46:08 | 20 |
| 70.3 WC | 6:04:39 | 319 |
| Arizona | 13:21:03 | 66 |
| Chattanooga | 13:25:22 | 53 |
| Copenhagen | 11:29:35 | 78 |
| Lake Placid | 12:48:13 | 32 |
| Texas | 12:45:42 | 59 |
| WC St George | 13:51:28 | 76 |
| WC Kona | 13:14:42 | 291 |
One of us
From the numbers we can see that XC triathletes are not that different from regular triathletes – they are likely just really busy people who appreciate and are able to invest in the XC offering as a way to be able to participate in a sport that they love. The perks of being in XC may not necessarily help you finish faster, it just gives a different type of person additional access to triathlon. That said, the numbers have a very skewed demographic—in gender, age, and geography—so “one of us” is not exactly an inclusive term.