Published November 7, 2017 12:04PM
This Bike Computer Provides Next-Level Analysis of Your Ride
Leomo’s groundbreaking new Type-R packs a virtual motion-analysis lab into a small, sleek bike computer.
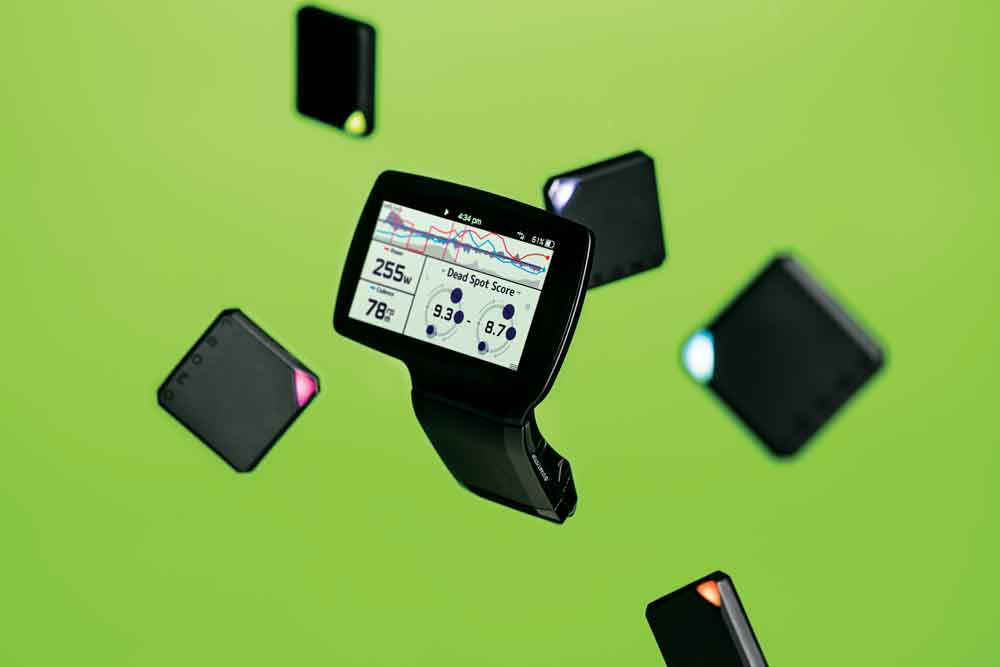
Photo: Oliver Baker
Leomo’s groundbreaking new Type-R packs a virtual motion-analysis lab into a small, sleek bike computer.
Leomo’s Type-R adds biomechanics and technique to the typical power/heart-rate/GPS mix of bike data for next-level analysis of your ride. It records foot angle, thigh angle and hip angle, then combines that complex 3D data with any other info an ANT+ device can throw at it. The Type-R uses sensors placed on the body and powerful data-analysis software to show athletes in real time things like which leg they’re favoring and where they have dead spots in their pedal stroke. We got to try it out at the Los Angeles velodrome and were floored by the mountains of data, though it’s difficult to interpret without the help of a great coach. For those coaches, there’s less eyeballing (“Your hip angle is too tight!” or “You’re reaching for the pedals!”) or costly time with an athlete in an unrealistic lab. Bonus for triathletes: In the future, Leomo’s motion-analysis tech has possible applications in running, swimming and even strength training and physical therapy. Even better, Leomo’s creators are building a brain trust with the greatest athletes, coaches and scientists to help everyone better understand what to do with the deluge of data that the Type-R dishes out.
- At less than 2mm thick, the Type-R’s head unit is shockingly thin, but it’s able to collect 100 data points per second.
- Five lightweight Bluetooth sensors, about the size of a square poker chip, use three-axis gyroscopes and three-axis accelerometers to collect position data.
- Two of the sensors clip onto shoes, two tuck into the thighs of your shorts and one sticks by your sacrum with the included adhesive.
- Yes, the Type-R is all about real-time data, but it also uploads activity data to your computer for crazy in-depth post-ride analysis.
- The touch display shows graphs, charts and useful info like a “dead spot” score to track where your pedaling form is lapsing and why.