Published October 14, 2023 02:19AM
The Women's 2023 Hawaii Ironman World Championship Bike Count
Feast upon the data and analysis behind the frames, components, aerobars, wheels, and more in the women's 2023 Ironman World Championship bike count.
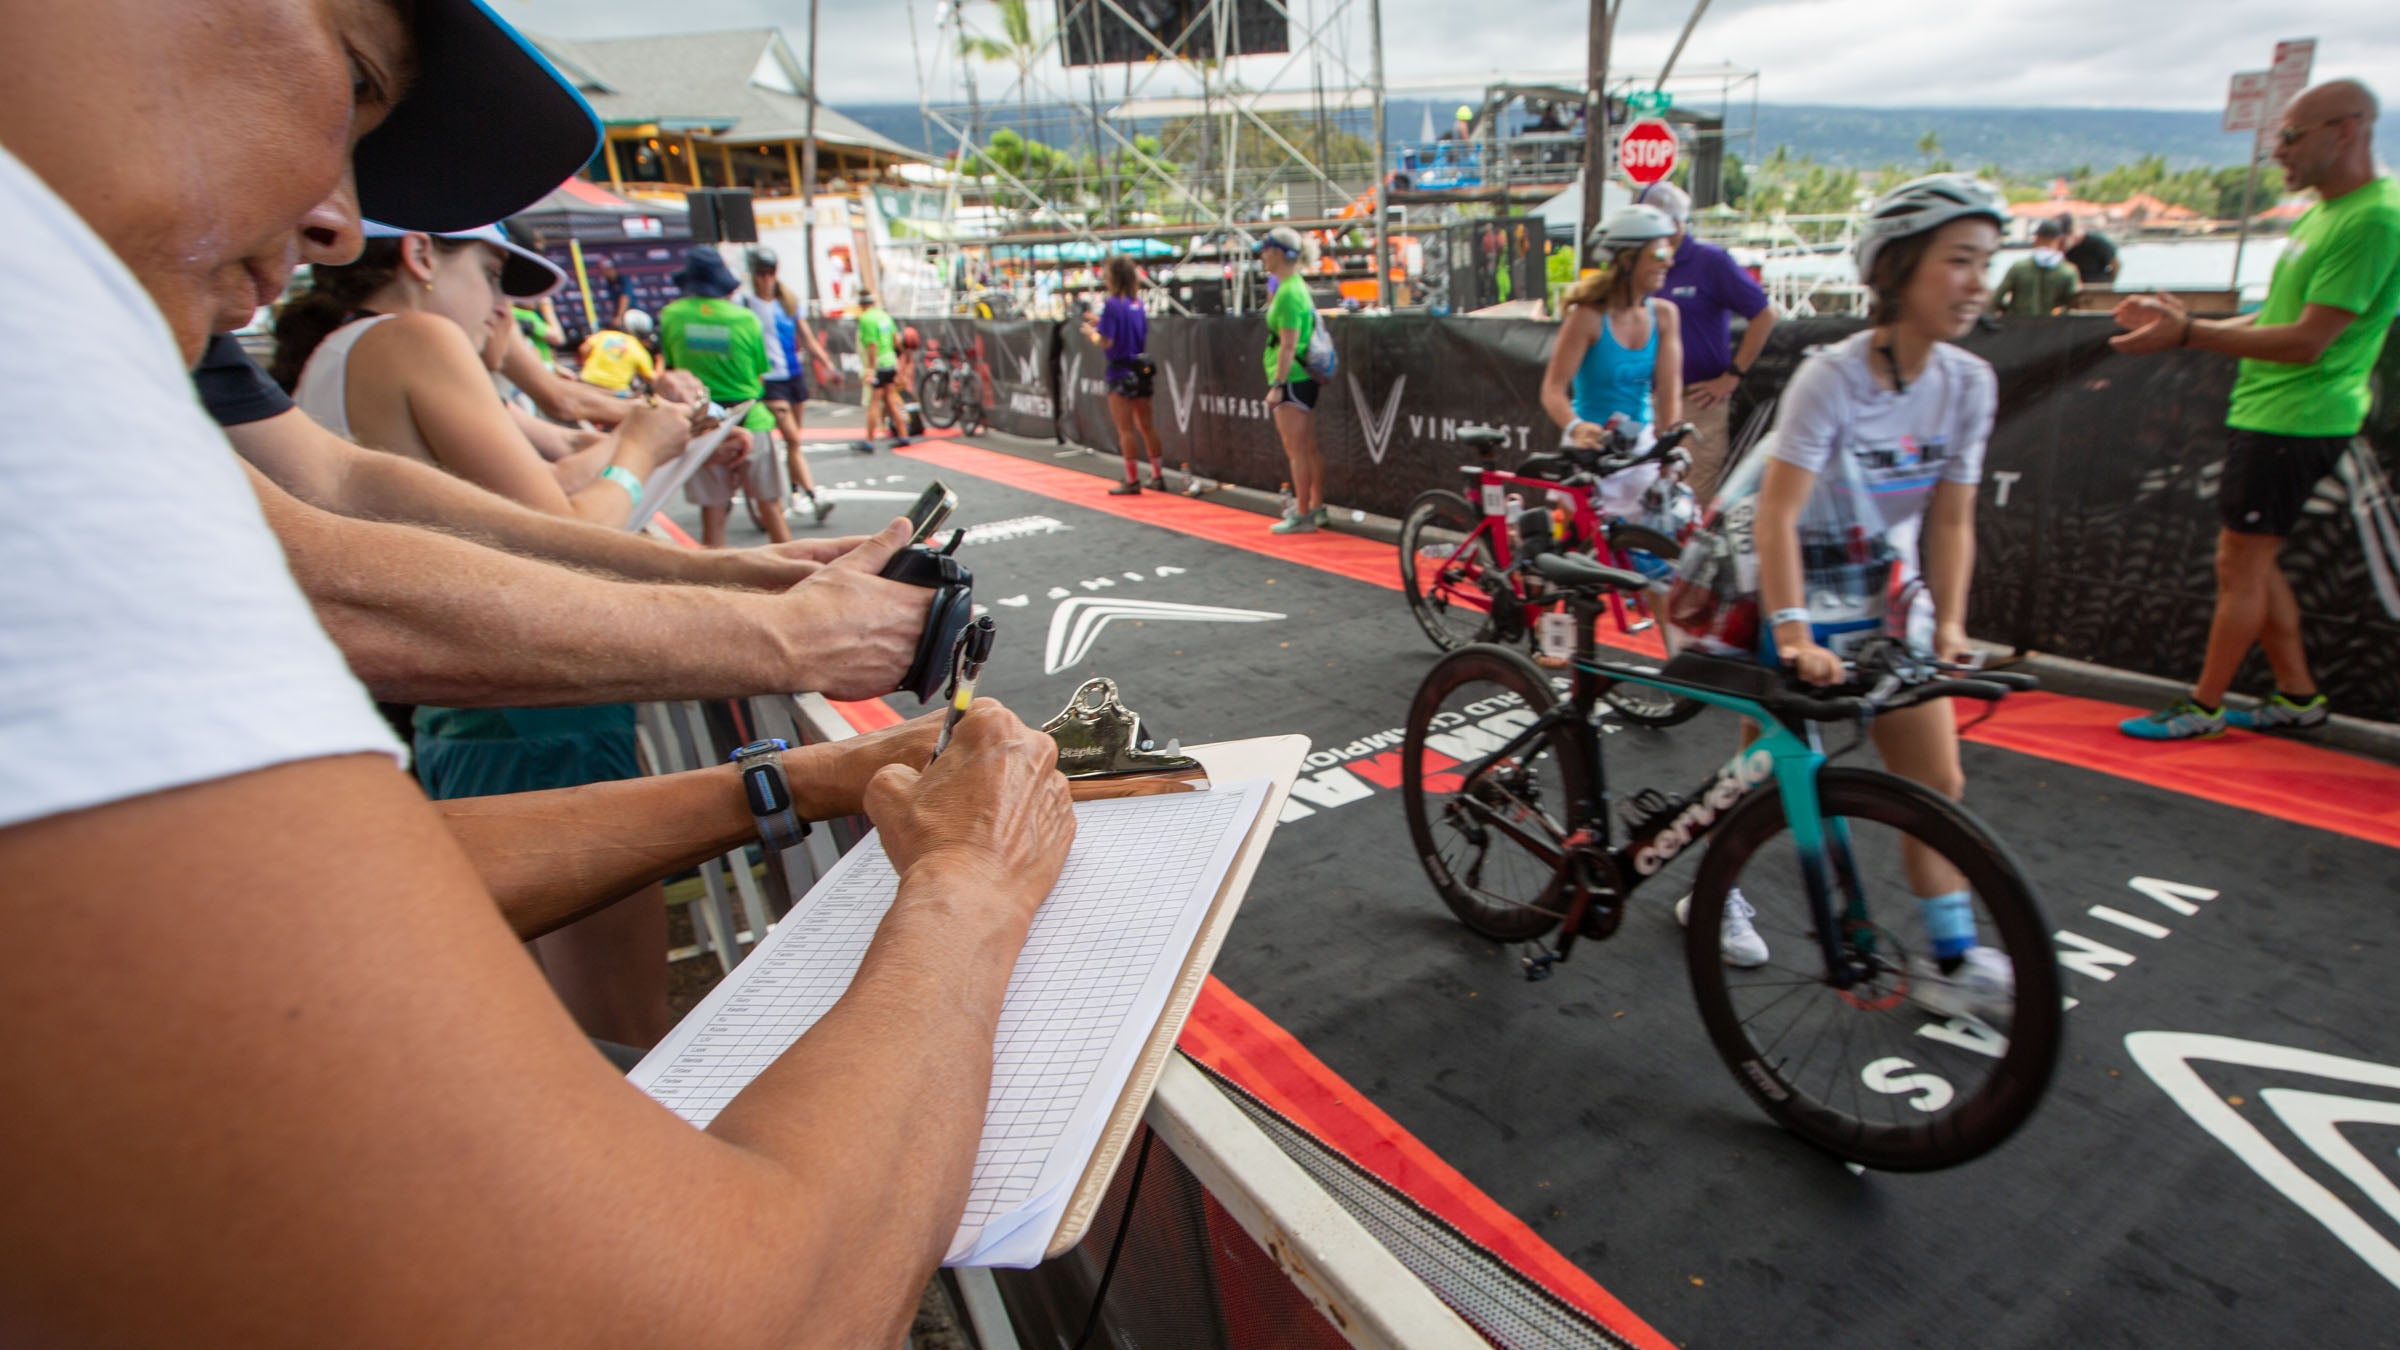
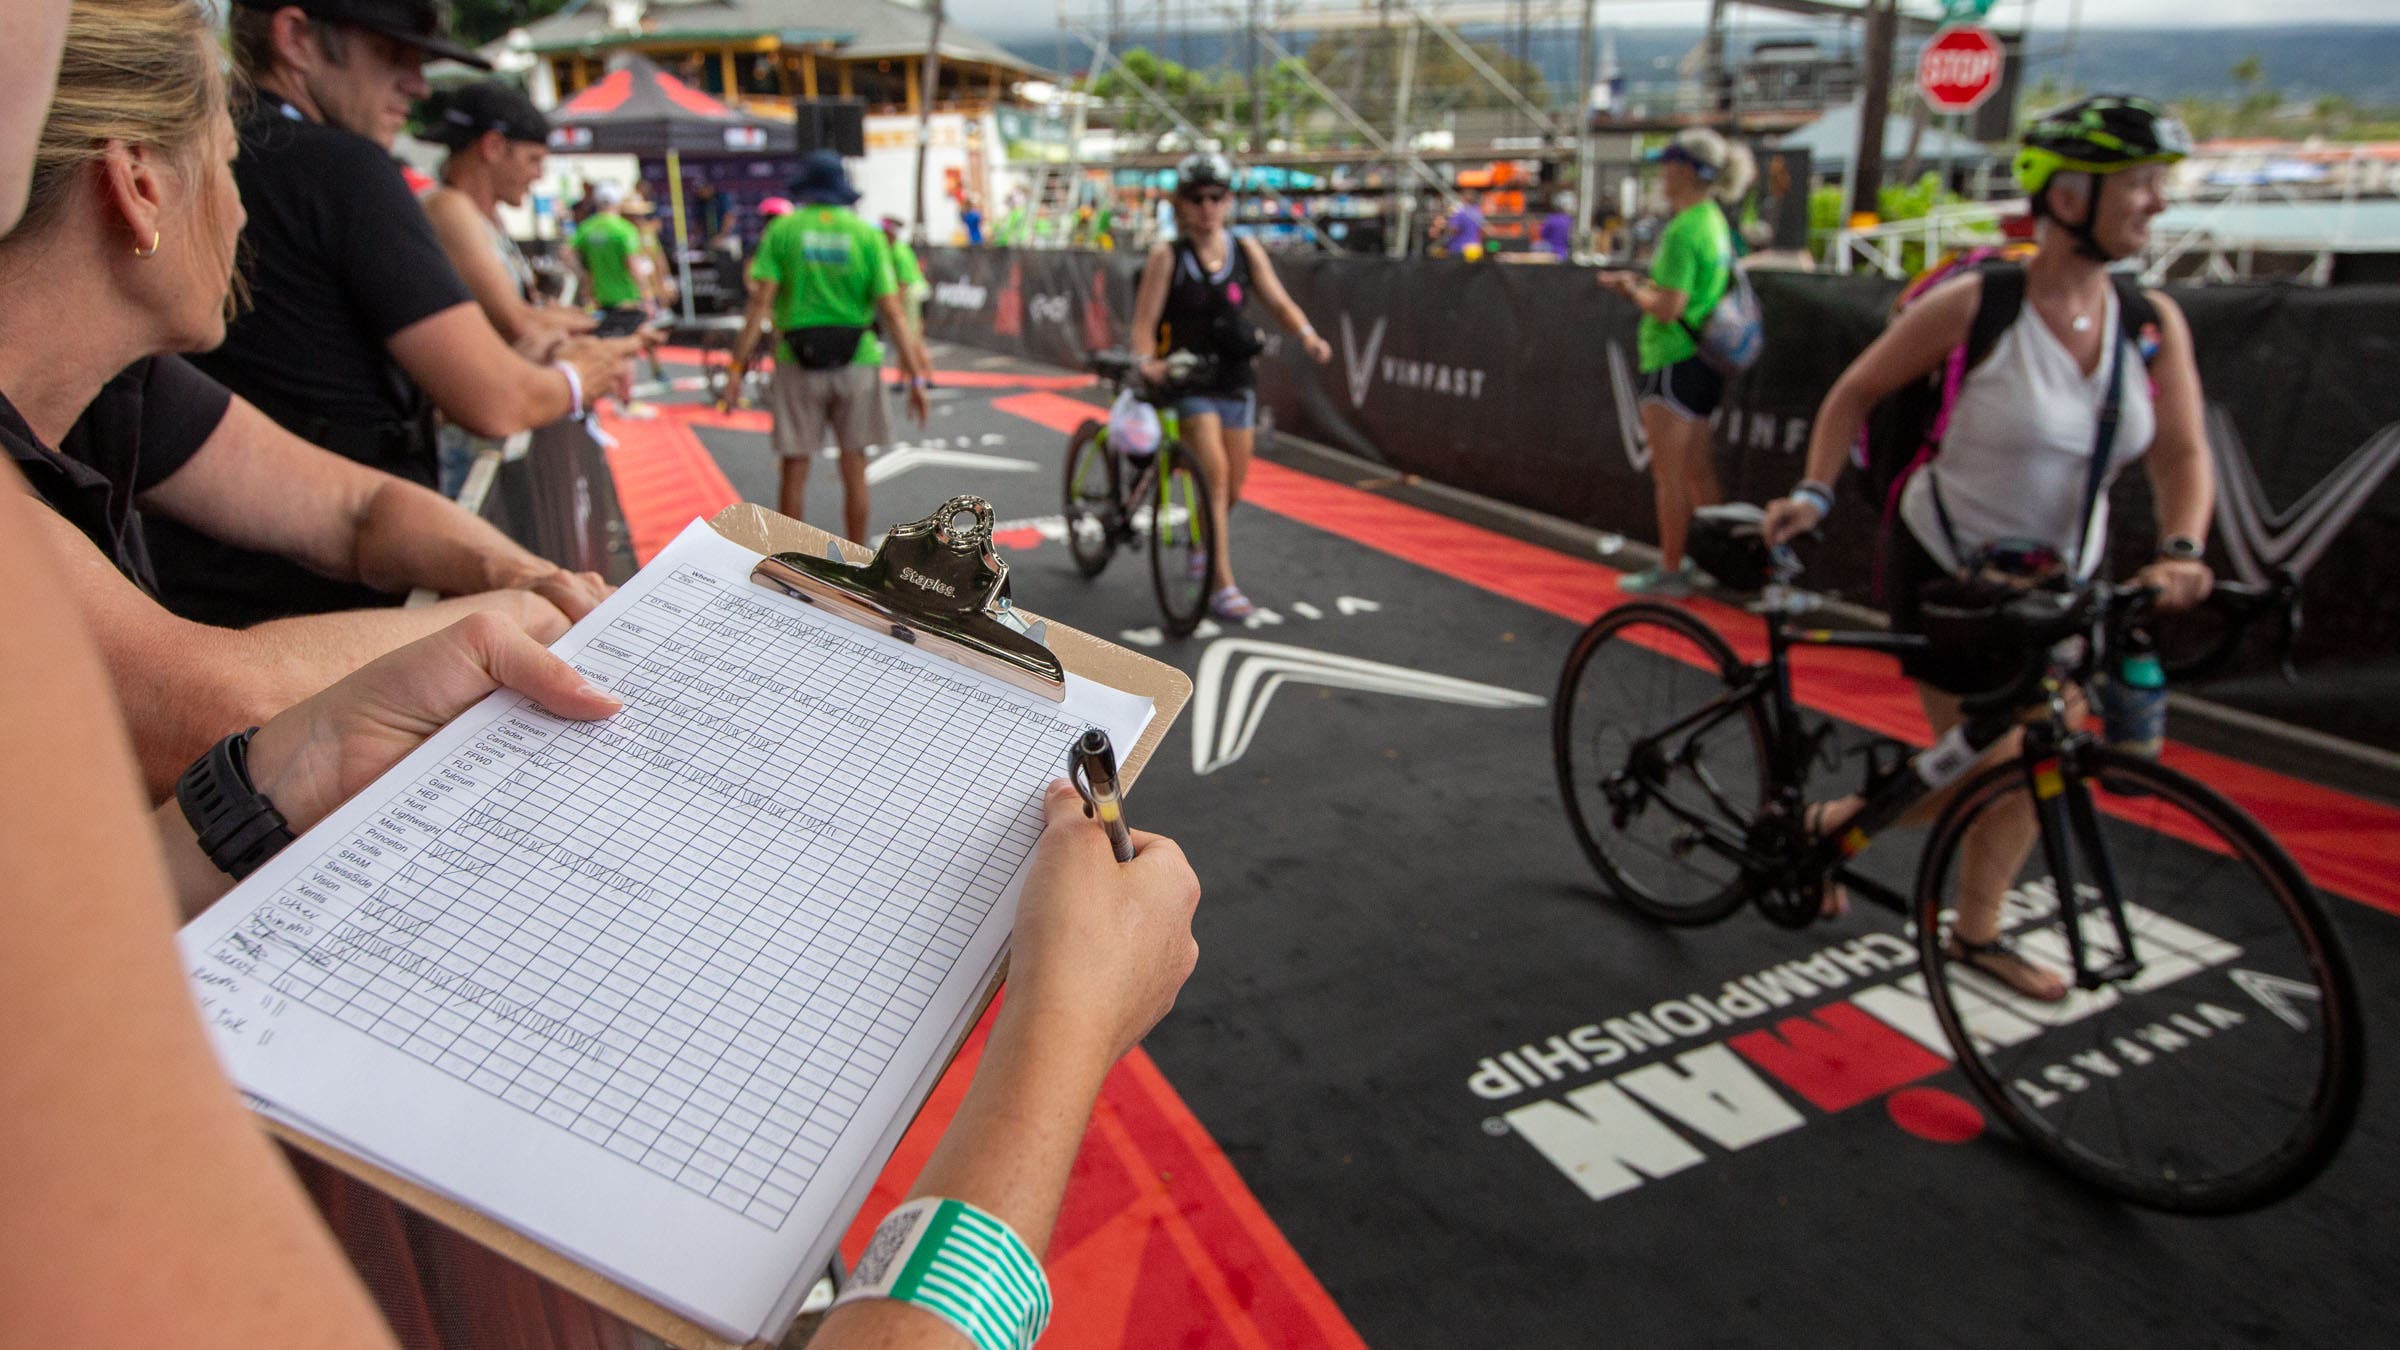
See the results of the 2023 Kona Bike Count from the women's Hawaii Ironman World Championship. (Photo: Brad Kaminski/Triathlete)
Women's 2023 Hawaii Ironman World Championship Bike Count
Given the fact that this is the first time the Ironman World Championships have been split by both location and gender, the Kona bike count is bound to reveal some interesting trends. While the men raced in Nice, France, back in September on a decidedly technical bike course, the women are in the same place as they’ve always been since the first time the Hawaii Ironman was held on the Big Island back in 1981. But unlike last year, when the women were split with a few select men’s age groups on the two-day event, this year the women have their own day in Kona.
So for the first time we’re seeing women’s-only U.S.-based data on tri gear that ranges from bikes to aerobars to components, wheels, saddles, power meters, pedals, and front hydration. Read below for the winner of this year’s bike count in eight categories and our quick takes on some surprising trends versus 2022 and the bike count from the men’s race last month in Nice.
Also be sure to check out our photo gallery from today’s age-group bike check-in at the women’s 2023 Ironman World Championships in Kona as well as our pro bike galleries.
Visit our Kona Central hub for news, analysis, history, photo galleries, and so much more – new stories added daily from our team on the ground at the women’s 2023 Ironman World Championship.
ADVERTISEMENT
Women’s 2023 Ironman World Championship Nice Bike Count
Bikes
Unlike back in September when Canyon took a surprising and commanding victory in the Ironman World Championship bike count, longtime bike count champion Cervelo is back to its old tricks at the top of the heap. In Nice, Cervelo was roughly 4% behind Canyon, but in Kona we see Canyon sent far back to fourth place—a whopping 13% behind Cervelo.
Other big notable movers from Nice to Kona include Quintana Roo moving up from a total 3% of bikes in 10th place in Nice to 11% in third place (also a big leap forward from 2022 in Kona, coming up from sixth place and 5% of total bikes). Interestingly Specialized and BMC lost quite a bit of ground in Kona this year, both dropping roughly 3%.
| Brand | Total Bikes | Percent |
| Cervelo | 433 | 23.64 |
| Trek | 245 | 13.37 |
| Quintana Roo | 206 | 11.24 |
| Canyon | 186 | 10.15 |
| Felt | 139 | 7.59 |
| Specialized | 117 | 6.39 |
| Giant/Liv/CADEX | 107 | 5.84 |
| Argon 18 | 81 | 4.42 |
| BMC | 53 | 2.89 |
| Ventum | 24 | 1.31 |
| Cannondale | 24 | 1.26 |
| Scott | 23 | 1.26 |
| Orbea | 23 | 1.09 |
| Ceepo | 20 | 0.66 |
| Fuji | 12 | 0.60 |
| Pinarello | 11 | 0.44 |
| Dimond | 11 | 0.38 |
| Ku | 8 | 0.27 |
| Cube | 7 | 0.27 |
| Parlee | 5 | 0.22 |
| Factor | 5 | 0.22 |
| Merida | 4 | 0.22 |
| Kestrel | 4 | 0.22 |
| Guru | 4 | 0.22 |
| Airsteem | 4 | 0.22 |
Aerobars
While there’s still not a huge shakeup in the aerobar category (there rarely is), we see quite a bit fewer stock Canyon bars, which makes sense given the decline in numbers of Canyon bikes from Nice to Kona this year. Profile Design is still the reigning champ, but sharply increasing share from both Nice 2023 and Kona 2022 by 10%. Also unsurprisingly we see a huge drop in bikes without aerobars from Nice to Kona—given how technical the course was in France.
| Brand | Total | Percent |
| Profile Design | 687 | 37.00 |
| Trek/Bontrager | 232 | 12.49 |
| Zipp | 126 | 6.79 |
| Felt | 107 | 5.76 |
| 3T | 106 | 5.71 |
| Vision | 97 | 5.22 |
| Cervelo | 91 | 4.90 |
| Giant | 70 | 3.77 |
| Specialized | 61 | 3.28 |
| 51 Speed Shop | 51 | 2.75 |
| Canyon | 50 | 2.69 |
| Unknown | 46 | 2.48 |
| Argon 18 | 41 | 2.21 |
| Without (drop) | 21 | 1.13 |
| Drag2Zero | 18 | 0.97 |
| Pro | 16 | 0.86 |
| Ventum | 16 | 0.86 |
| Aerocoach | 11 | 0.59 |
| USE | 10 | 0.54 |
Components
Components are also another category where change comes slowly or not at all. Shimano still has a commanding lead over second-place SRAM with a nearly identical 76% share compared to 75% in Nice.
| Brand | Percent |
| Shimano | 76.27 |
| SRAM | 23.24 |
| Campagnolo | 0.49 |
Wheels
Wheels show very different trends between the men in Nice and the women in Kona: In France DT Swiss had a surprising lead (for the first time over Zipp), however fell far in share in Kona—dropping 11%. Again, this is likely due to far fewer Canyon bikes in the Kona field (DT Swiss comes stock on most Canyons). Zipp is back on top in Kona with 18% of the share, however it’s still a big drop from the 30% share they enjoyed in the combined count in Kona last year. Elsewhere, HED and Bontrager moved up considerably, with an increase in 3% each, while Mavic fell by roughly the same amount.
| Brand | Total | Percent |
| Zipp | 715 | 18.19 |
| Other | 499 | 12.69 |
| DT Swiss | 381 | 9.69 |
| Bontrager | 356 | 9.06 |
| HED | 347 | 8.83 |
| Aluminum | 272 | 6.92 |
| ENVE | 270 | 6.87 |
| Reynolds | 261 | 6.64 |
| Roval | 159 | 4.04 |
| Vision | 115 | 2.93 |
| Giant/CADEX | 94 | 2.39 |
| Mavic | 90 | 2.29 |
| FFWD | 44 | 1.12 |
| SwissSide | 42 | 1.07 |
| Reserve | 39 | 0.99 |
| Hunt | 34 | 0.86 |
| Shimano | 28 | 0.71 |
| FLO | 26 | 0.66 |
| Princeton | 24 | 0.61 |
| Rolf | 24 | 0.61 |
| Campagnolo | 23 | 0.59 |
| Profile Design | 20 | 0.51 |
| Fulcrum | 18 | 0.46 |
| Ku | 10 | 0.25 |
| Boyd | 9 | 0.23 |
| Lightweight | 7 | 0.18 |
| Red Crown | 6 | 0.15 |
| Corima | 6 | 0.15 |
| Easton | 6 | 0.15 |
| 3T | 6 | 0.15 |
Saddles
Though we didn’t have a saddle count in Nice, looking back to 2022 almost nothing has changed in the rankings—ISM is still king, but increases by 3%—while Fizik loses substantial share in a year from 14% to 9%. Selle Italia, on the other hand, moves into the third spot with an increase of 3%.
| Brand | Percent |
| ISM | 39.24 |
| Specialized | 16.43 |
| Selle Italia | 10.40 |
| Fizik | 8.87 |
| Bontrager | 7.27 |
| Cobb | 6.21 |
| Other | 4.08 |
| Prologo | 4.02 |
| Terry | 1.24 |
| SMP | 1.18 |
| Gebiomized | 1.06 |
Power Meters
Since we haven’t had power meter data since before COVID, there’s not much comparison, but it is interesting to note that over half of the racers are using no power meters, Garmin is ahead in the power meter count, but just barely compared to Quarq, while Assioma sits in third.
| Brand | Total | Percent |
| None | 1160 | 58.09 |
| Garmin | 267 | 13.37 |
| Quarq | 250 | 12.52 |
| Assioma | 156 | 7.81 |
| Rotor | 62 | 3.10 |
| Shimano | 27 | 1.35 |
| Wahoo | 20 | 1.00 |
| Stages | 19 | 0.95 |
| 4iiii | 11 | 0.55 |
| Pioneer | 10 | 0.50 |
| Powertap | 7 | 0.35 |
| SRM | 5 | 0.25 |
| Power2Max | 3 | 0.15 |
Pedals
Even with a likely increase in pedal-based power meter use, it’s surprising to see a big increase in number-one Shimano from 25% in 2022 to 35% in 2023, while Look loses share and Garmin and Speedplay/Wahoo stay roughly the same, as Assioma moves up since 2022.
| Brand | Total | Percent |
| Shimano | 661 | 34.99 |
| Look | 367 | 19.43 |
| Garmin | 357 | 18.90 |
| Speedplay/Wahoo | 213 | 11.28 |
| Assioma | 159 | 8.42 |
| Time | 101 | 5.35 |
| Powertap | 31 | 1.64 |
Front Hydration
It’s also been a while since we had good data on front hydration systems, but Profile Design has a tiny lead over XLab in the between-the-arms hydration race with 44% and 43%, respectively, as other solutions sit far behind.
| Front Hydration | Total | Percent |
| Profile Design | 538 | 44.43 |
| Xlab | 528 | 43.60 |
| Integrated | 87 | 7.18 |
| Bontrager | 31 | 2.56 |
| Speedfil | 18 | 1.49 |
| Giant | 9 | 0.74 |
Big thanks to our friends at Slowtwitch.com and members of the triathlon industry for their work on this year’s official Kona bike count.